R Shiny dashboard leaflet popup image broken after hosting on shiny server

Hi,

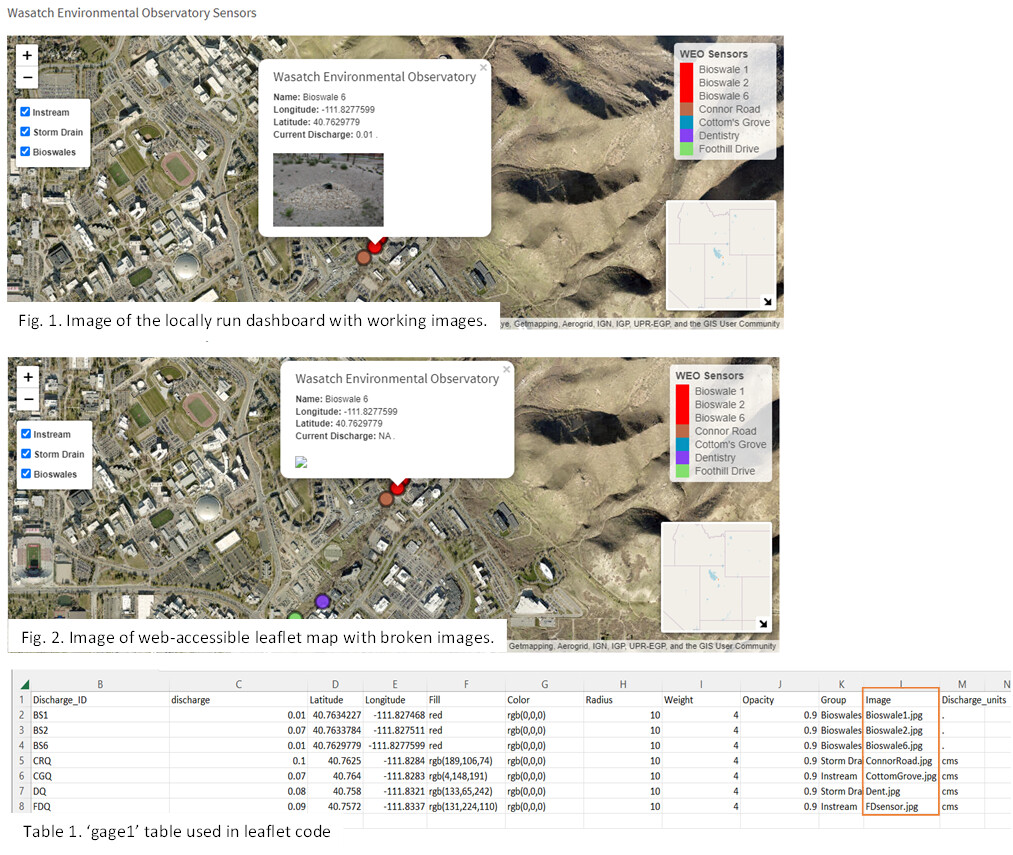
I am having an issue with broken images in leaflet map popups in an R Shiny dashboard. This is the first Shiny app that I've created, so I'm new to the process, and this is probably an easy fix. My previous university is hosting my dashboard on a Linux VM. When I run the app.R file locally on my computer, the images in my leaflet map popups are working and should look like Fig. 1 in the image below. When I go to the web-accessible dashboard (landscape-lab.chpc.utah.edu), the images are broken and look like Fig. 2 in the image below.

I am referencing a table, 'gage1', that I created to define the marker colors, names, lat/long coordinates, images, etc. (Table 1 in the image below). My leaflet code is referencing everything in the table 'gage1' correctly except for the images.

This is probably an easy fix, but does anyone know why the images would work when I run this locally on my computer and not on the shiny server? I verified that all the files and folders are in the App-1 folder (i.e., www, data, app.R) on the shiny server. I have also verified the spelling of the images in the www folder matches what is in the 'gage1' table. Below is the code that I am using.

Any suggestions would be greatly appreciated! Thank you in advance for your time and support.

###Landscape Lab Dashboard
##By: Yvette Hastings
##Written: March 31, 2022
##Last Updated: Dec. 14, 2022

##install packages
# install.packages("shiny")
# install.packages("shinydashboard")
# install.packages("shineywidgets")
# install.packages("leafpop")
# install.packages("leaflet")

##libraries
library(shiny)
#> Warning: package 'shiny' was built under R version 4.1.3
library(readxl)
#> Warning: package 'readxl' was built under R version 4.1.3
library(shinydashboard)
#> Warning: package 'shinydashboard' was built under R version 4.1.3
#> 
#> Attaching package: 'shinydashboard'
#> The following object is masked from 'package:graphics':
#> 
#>     box
library(shinyWidgets)
#> Warning: package 'shinyWidgets' was built under R version 4.1.3
library(leafpop)
#> Warning: package 'leafpop' was built under R version 4.1.3
library(leaflet)
#> Warning: package 'leaflet' was built under R version 4.1.3
library(dplyr)
#> Warning: package 'dplyr' was built under R version 4.1.3
#> 
#> Attaching package: 'dplyr'
#> The following objects are masked from 'package:stats':
#> 
#>     filter, lag
#> The following objects are masked from 'package:base':
#> 
#>     intersect, setdiff, setequal, union

##sensor sites
gage1 <- read_excel("data/Gage_sites.xlsx")
#> Error: `path` does not exist: 'data/Gage_sites.xlsx'


##Build Dashboard
ui <- dashboardPage(title = "Landscape Lab Dashboard",
                    
                    dashboardHeader(title = span("Landscape Lab Dashboard", style = "font-size: 22px") ,titleWidth = 300, 
                                    tags$li(class = 'dropdown',
                                            a(img(src = 'Uicon.png', height = '40px'),
                                              style = 'padding-top: 10px; padding-bottom: 10px;'),
                                            tags$style(".main-header {max-height: 60px;}"),
                                            tags$style(".main-header .logo {height: 60px;}"),
                                            tags$script(HTML("$('body').addClass('fixed');"))
                                    )),


                    dashboardSidebar(width = 220, 
                                     tags$style(".main-sidebar {padding-top: 70px; left-padding: 5px; font-size: 15px;
                              position: fixed; overflow: visible;}"),
                                     
                                     
                                     sidebarMenu(id = "sidebar",
                                                 menuItem(text = "Hydrology", tabName = "hdashboard", icon = icon("water")),
                                                 menuItem("Soil", tabName = 'edashboard', icon = icon("leaf")))),


                    # body ---- 
                    dashboardBody(
                      tabItems(
                        #page 1 ---
                        tabItem(tabName = "hdashboard", 
                                ##set first row of dashboard and contents
                                fluidRow(
                                  column(width = 2),
                                  column(width =8,
                                         box(width = 12,
                                             title = "Wasatch Environmental Observatory Sensors", status = "primary",
                                             leafletOutput("LLmap", height = 400))),
                                  column(width = 2))))))

server <- function(input, output) {
  
  ##leaflet map built based on gage1 datatable and discharge info added to popup
  output$LLmap <- renderLeaflet({
    
    leaflet(gage1) %>%
      setView(zoom = 15, lng = -111.828, lat = 40.7605) %>%
      addProviderTiles(providers$Esri.WorldImagery) %>%
      addCircleMarkers(lng= ~Longitude, lat = ~Latitude,
                       popup = paste(
                         "<h4>Wasatch Environmental Observatory</h4>",
                         "<b>Name: </b>", gage1$Name,
                         "<br>",
                         "<b>Longitude: </b>", gage1$Longitude,
                         "<br>",
                         "<b>Latitude: </b>", gage1$Latitude,
                         "<br>",
                         "<b>Current Discharge: </b>", gage1$discharge, gage1$Discharge_units,
                         "<br>",
                         "<br>",
                         "<img src =", gage1$Image, "width = '150px'>"),
                       label = gage1$Name, labelOptions = labelOptions(textsize = '10px'),
                       radius = ~Radius, color = ~Color, fillColor = ~Fill,
                       fillOpacity = ~Opacity, weight = ~Weight, group = ~Group) %>%
      addLegend("topright",
                colors = ~Fill,
                labels = ~Name,
                title = "WEO Sensors", opacity =1) %>%
      addLayersControl(overlayGroups = c("Instream", "Storm Drain", "Bioswales"),
                       options = layersControlOptions(collapsed = FALSE),
                       position = "topleft") %>%
      addMiniMap(position = "bottomright", zoomLevelOffset = -11, toggleDisplay = TRUE)
    
  })}

shinyApp(ui = ui, server = server)

Hi, the link doesn't work: labscape-lab.chpc.utah.edu

In regards to the image problem, does the Shiny Server still have access to those images? Should the link be changed (e.g. changing folders)?

Hi williaml,

Thank you for your response. My apologies about the link...I had a typo, which I fixed in my original post. https://landscape-lab.chpc.utah.edu/; it takes about 30-45 seconds to load, sometimes less (I think because it is being run on one core on a Linux VM).

I followed the file folder structure that is on the Shiny tutorials.

App-1 - main file folder that contains the www and data folder, as well as the app.R file.
www - contains the images; jpg (images for leaflet map) and png (dashboard header image)
data - has my data files used for the dashboard
app.R file - the code for the dashboard

The Shiny Server does have access to those images. On the web-accessible page, you'll see an image at the top right in the blue header that I added, and it is working just fine. So, I know the Shiny Server has access to the images in the www folder. The code for the image in the header is different than what I had to use for the leaflet code.

dashboard header image:

,tags$li(class = 'dropdown',
                                   a(img(src = 'Uicon.png', height = '40px'),
                                              style = 'padding-top: 10px; padding-bottom: 10px;'),

current leaflet popup:

addCircleMarkers(lng= ~Longitude, lat = ~Latitude,
                       popup = paste(
                         "<h4>Wasatch Environmental Observatory</h4>",
                         "<b>Name: </b>", gage1$Name,
                         "<br>",
                         "<b>Longitude: </b>", gage1$Longitude,
                         "<br>",
                         "<b>Latitude: </b>", gage1$Latitude,
                         "<br>",
                         "<b>Current Discharge: </b>", gage1$discharge, gage1$Discharge_units,
                         "<br>",
                         "<br>",
                         "<img src =", gage1$Image, "width = '150px'>")

Originally, I was using paste0() in front of the image source code to add the images in the leaflet popup, but this stopped working when I ran a local test on my computer after the last R update (the paste0 option never worked on the Shiny Server), so I changed it to an HTML format (which runs locally, but still not on the Server). I've also tried adding ' ' around the image name in the data table, adding the file path to the data table, changing the images from jpg to png, and adding ' ' around the 'gage1$Image' in the leaflet code. I'm pretty sure the problem has to do with the 'img src =' code in the leaflet block. Any thoughts?

Thank you again for your time and support!

1 Like

Thanks for the additional information. I'm not quite sure. Hopefully someone with more expertise in the area can help on this.

Hi @yhorse,
It appears that your code is functioning correctly, and the tests you conducted are appropriate and useful.
However, upon testing your app, I have found that some images are accessible and visible on the map:
https://landscape-lab.chpc.utah.edu/FDsensor.jpg
while others are not:
https://landscape-lab.chpc.utah.edu/ConnorRoad.jpg
Possible causes for this could be issues with the uploading of the files, such as file corruption.

1 Like

Hi @hichammoadsafhi ,

Thank you for your response. Since I graduated from my previous university, I no longer have direct access to the server folders, so I am waiting for another student to re-upload the pictures and test. I'll let you know what happens.

Hi @yhorse, another issue could be the file extension. I notice the link above downloads the image if .jpg is changed to .JPG.
https://landscape-lab.chpc.utah.edu/ConnorRoad.JPG

1 Like

Hi @hichammoadsafhi,

Re-uploading the image files didn't work. I am going to try changing the file extension in my table, as suggested by scottyd22.

Hi @scottyd22,

Thank you for your reply. I had only looked at the image extensions in my file explorer window and had never considered there was a difference between .JPG and .jpg. I see in the image properties that most of my images in the leaflet popups are the .JPG version, and FDsensor is the only one with .jpg extension. I've updated my files, sent them to the student with server access, and will let you know what happens when they upload this fix to the server.

Hi @scottyd22 ,

Thank you again for your reply to my post and for pointing out the file extension. I finally heard back from the student who has server access, and changing the extension to .JPG worked!

1 Like

This topic was automatically closed 7 days after the last reply. New replies are no longer allowed.

If you have a query related to it or one of the replies, start a new topic and refer back with a link.