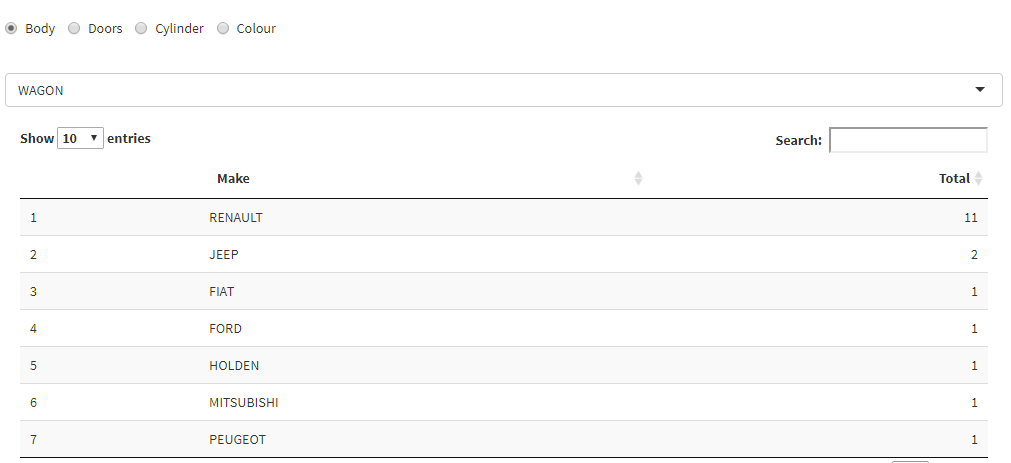
I am building a Shiny App where I can filter quantity of cars sold based on some selections of car specifications (Body, Doors, Cylinder, Colour). And under them, there are more sub-filters which I used conditional panels to build.
But I think my filtering has some problems, because when I switch to other specifications, the quantity just stays the same.
Data:
master_data_original <- tibble::tribble(
  ~Make, ~Body, ~Doors, ~Cyls, ~Colour,    ~SaleDate,
  "RENAULT",        "VAN",           4L,       4L,     "WHITE",  "7/08/2020",
  "RENAULT",        "VAN",           4L,       4L,     "WHITE",  "7/08/2020",
  "FIAT",        "VAN",           4L,       4L,     "WHITE", "31/07/2020",
  "JEEP",    "UTILITY",           4L,       6L,       "RED",  "4/06/2020",
  "RENAULT",        "VAN",           5L,       4L,     "BLACK", "18/07/2020",
  "RENAULT",      "COUPE",           2L,       4L,    "SILVER", "30/07/2020",
  "RENAULT",        "VAN",           4L,       4L,     "WHITE",  "7/08/2020",
  "JEEP",      "WAGON",           5L,       8L,     "WHITE",  "8/08/2020",
  "RENAULT",        "BUS",           4L,       4L,     "WHITE", "10/08/2020",
  "RENAULT",      "WAGON",           5L,       4L,      "GREY",  "8/08/2020",
  "RENAULT",        "VAN",           5L,       4L,     "WHITE", "10/08/2020",
  "RENAULT",        "VAN",           5L,       4L,     "WHITE",  "8/08/2020",
  "MITSUBISHI",    "UTILITY",           4L,       4L,     "BLACK",  "6/08/2020",
  "JEEP",      "WAGON",           5L,       6L,     "BLACK", "28/12/2019",
  "RENAULT",        "VAN",           5L,       4L,      "GREY",  "3/01/2020",
  "MITSUBISHI",      "WAGON",           5L,       4L,     "WHITE",  "8/01/2020",
  "RENAULT",      "WAGON",           5L,       4L,     "WHITE", "15/05/2019",
  "RENAULT",  "HATCHBACK",           5L,       3L,     "WHITE", "10/05/2017",
  "HOLDEN",      "SEDAN",           4L,       4L,       "RED", "18/05/2017",
  "PEUGEOT",  "HATCHBACK",           5L,       4L,     "WHITE", "18/03/2020",
  "FORD",    "UTILITY",           2L,       6L,     "WHITE", "17/07/2015",
  "HOLDEN",      "WAGON",           5L,       4L,      "GREY", "29/06/2019",
  "RENAULT",      "WAGON",           5L,       4L,     "WHITE",  "3/07/2019"
)

head(master_data_original)
#> Warning: `...` is not empty.
#>
#> We detected these problematic arguments:
#> * `needs_dots`
#>
#> These dots only exist to allow future extensions and should be empty.
#> Did you misspecify an argument?
#> # A tibble: 6 x 6
#>   Make    Body    Doors  Cyls Colour SaleDate
#>   <chr>   <chr>   <int> <int> <chr>  <chr>
#> 1 RENAULT VAN         4     4 WHITE  7/08/2020
#> 2 RENAULT VAN         4     4 WHITE  7/08/2020
#> 3 FIAT    VAN         4     4 WHITE  31/07/2020
#> 4 JEEP    UTILITY     4     6 RED    4/06/2020
#> 5 RENAULT VAN         5     4 BLACK  18/07/2020
#> 6 RENAULT COUPE       2     4 SILVER 30/07/2020
Code:
library(shiny)
library(shinydashboard)
library(shinyWidgets)
library(dplyr)
library(lubridate)
library(tidyr)
ui = dashboardPage(

  header = dashboardHeader(
    title = "Hello"),
  sidebar = dashboardSidebar(
      menuItem("Sales", tabName = "sales_4")
  ),
  body = dashboardBody(
              fluidRow(
                box(width = 12, title = "Car Characteristics", solidHeader = TRUE,status = "primary",
                    radioButtons("select_comparison", label = " ",
                                 c("Body" ,
                                   "Doors",
                                   "Cylinder" ,
                                   "Colour"), inline=T),
                    conditionalPanel(
                      condition = "input.select_comparison == 'Body'",
                      selectInput(
                        "body_selected",
                        " ",
                        choices = c("WAGON", 'SEDAN', 'UTILITY', 'VAN', 'BUS',
                                    'COUPE',   'HATCHBACK'
                                    ),
                        selected = 1,
                        multiple = FALSE,
                        selectize = TRUE,
                        width = NULL,
                        size = NULL
                      )),
                    conditionalPanel(
                      condition = "input.select_comparison == 'Doors'",
                      selectInput(
                        "doors_selected",
                        " ",
                        choices = c('2','4', '5'),
                        selected = NULL,
                        multiple = FALSE,
                        selectize = TRUE,
                        width = NULL,
                        size = NULL
                      )),
                    conditionalPanel(
                      condition = "input.select_comparison == 'Cylinder'",
                      selectInput(
                        "cylinder_selected",
                        " ",
                        choices = c('2','3','4', '5', '6', '7', '8'),
                        selected = NULL,
                        multiple = FALSE,
                        selectize = TRUE,
                        width = NULL,
                        size = NULL
                      )),
                    conditionalPanel(
                      condition = "input.select_comparison == 'Colour'",
                      selectInput(
                        "colour_selected",
                        " ",
                        choices = c('WHITE', 'SILVER', 'BLUE', 'BLACK', 'GREY', 'RED'
                                    ),
                        selected = NULL,
                        multiple = FALSE,
                        selectize = TRUE,
                        width = NULL,
                        size = NULL
                      )),
                    column(12,DT::dataTableOutput("Main_table"))


                )
              )
      )
)

# Define server logic required to draw a histogram
server <- function(input, output, session) {

    Main_data <- reactive({


        master_data_original$year_sales <- year(master_data_original$SaleDate)

        master_data_list_filter <- master_data_original %>% dplyr::filter(Body == input$body_selected|
                                                                          Doors== input$doors_selected|
                                                                          Cyls  == input$cylinder_selected|
                                                                          Colour == input$colour_selected)

        master_data_list_sum <- master_data_list_filter %>% group_by(Make, year_sales) %>% summarise(Count = n())

        master_data_list_sum <- spread(master_data_list_sum, year_sales, Count)

    })

    output$Main_table <- renderDataTable({
      req(input$select_comparison)
      isolate(Main_data)
      master_data_compare <- Main_data()

      master_data_compare[is.na(master_data_compare)] <- 0

      master_data_compare$Total <- rowSums(master_data_compare[-1])

      master_data_compare <- master_data_compare[, c("Make", "Total")]

      datatable(master_data_compare[order(-master_data_compare$Total),], escape = F)
    })


}

# Run the application
shinyApp(ui = ui, server = server)
I am not sure if my filter is the reason that causes the error. I want to see different quantity or at least reset to default choice (Nothing selected) when switching among the specifications.
Any help is really appreciated

 . I formatted my text code to reproducible example. Hope it is clearer