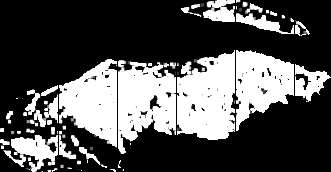
I am attempting the seemingly simple task of converting a .csv with lat, lon and population values into a .tif (raster).
Here's my R code:
    geoName <- read.csv("/pathToData/geoName.csv")
    geoName_raster <- raster(xmn=min(geoName$longitude), xmx=max(geoName$longitude), ymn=min(geoName$latitude), ymx=max(geoName$latitude), res=0.0027, crs="+proj=longlat +datum=WGS84")
    geoName_rasterize <- rasterize(geoName[, c('longitude', 'latitude')], geoName_raster, geoName[, 'population'], fun=sum)
    writeRaster(geoName_rasterize, "/pathToData/geoName_rasterize.tif")
The .csv is formatted like this:
    longitude,latitude,population
    -73.274688427539,19.817098050328,100.001
    -72.697905721098,19.82226569178,200.002
    -73.153838375345,19.799009402678,300.003
    -72.71163913536,19.873934311831,400.004
    -72.887420723946,19.863602053517,500.005
    -73.288421351258,19.850685573779,400.004
    -72.752838665811,19.79384121785,300.003
    -72.939605787255,19.871351380997,200.002
    -73.126372968453,19.713707358991,100.001
The output has bands of null values which appear to be influenced by the res value: the bands are further apart as res approaches 0.
- The .tif with narrow bands below is with no
resspecified

- The .tif with wide bands is with
res = 0.0027(which is the approximate width in degrees of a Bing tile at z17 which is the resolution of the population data set)

I've read a few different R documentation pages outlining resolution, but I don't really understand its function.
My questions: what is res doing and how do I replace these bands with the data which belongs in those pixels?
Be gentle: I'm very new to R.