Let's try this
plot(mtcars$mpg,mtcars$drat)
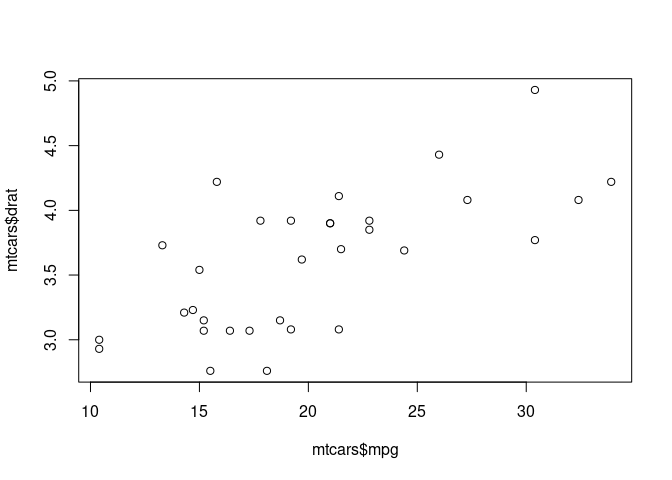
Created on 2022-11-26 by the reprex package (v2.0.1)
because it's unclear whether this is in an R script or within a chunk in an Rmarkdown document. If that doesn't work, come back with the output of
sessionInfo()
See the FAQ: How to do a minimal reproducible example reprex for beginners for the best way to illustrate problems that help is being asked on.