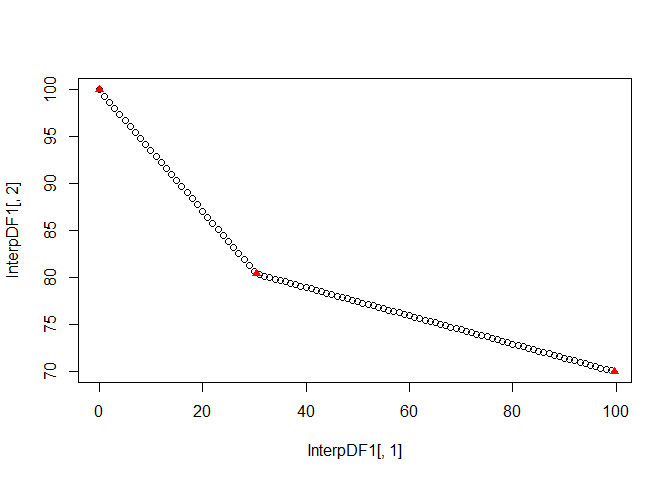
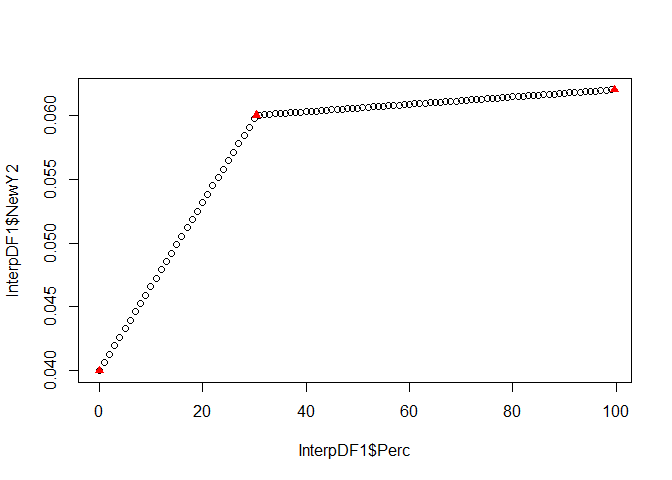
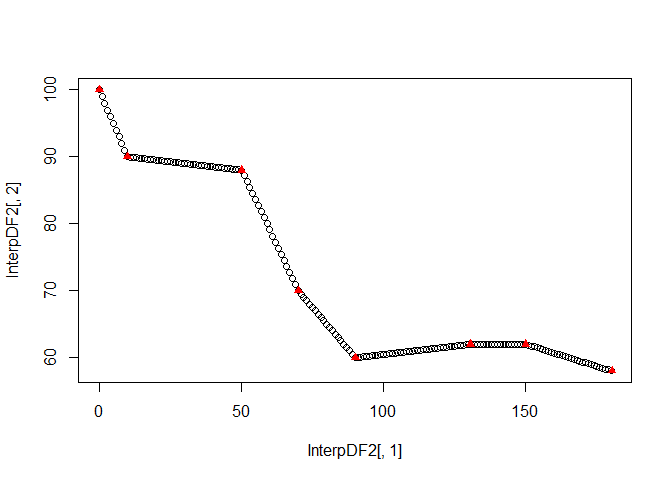
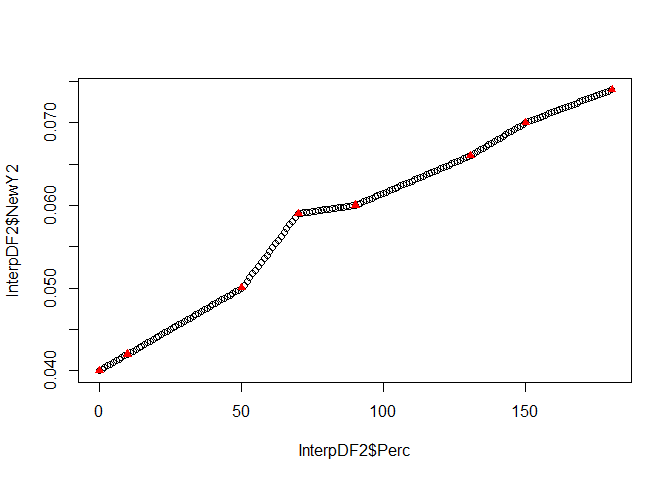
Here is a rough version of one approach. The red points show the initial data.
Percent <- c(0,30.4,99.6)
Value1 <- c(100,80.4,70)
Value2 <- c(0.04,0.06, 0.062)

DF1 <- data.frame(Percent,Value1,Value2)

Percent_A <- c(0,10,50.2,70,90.1,130.6,150,180.3)
Value1_A <- c(100,90,88,70,60,62,62,58)
Value2_A <- c(0.04,0.042,0.05,0.059,0.06,0.066,0.07,0.074)

DF2 <- data.frame(Percent_A, Value1_A, Value2_A)

InterpFunc <- function(DF){
  FUN1 <- approxfun(DF[, 1],DF[, 2])
  FUN2 <- approxfun(DF[, 1],DF[, 3])
  X1 <- ceiling(min(DF[, 1]))
  X2 <- floor(max(DF[, 1]))
  NewY1 <- FUN1(X1:X2)
  NewY2 <- FUN2(X1:X2)
  data.frame(Perc = X1:X2, NewY1, NewY2)
}
InterpDF1 <- InterpFunc(DF1)
plot(InterpDF1[, 1], InterpDF1[, 2])
points(DF1[, 1], DF1[, 2], col = "red", pch=17)
plot(InterpDF1$Perc, InterpDF1$NewY2)
points(DF1[, 1], DF1[, 3], col = "red", pch=17)
InterpDF2 <- InterpFunc(DF2)
plot(InterpDF2[, 1], InterpDF2[, 2])
points(DF2[, 1], DF2[, 2], col = "red", pch=17)
plot(InterpDF2$Perc, InterpDF2$NewY2)
points(DF2[, 1], DF2[, 3], col = "red", pch=17)
Created on 2021-10-28 by the reprex package (v2.0.1)