I have the following two data sets
'''
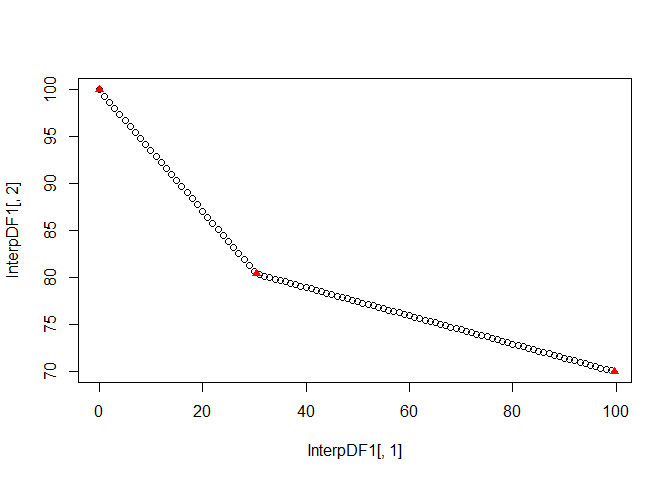
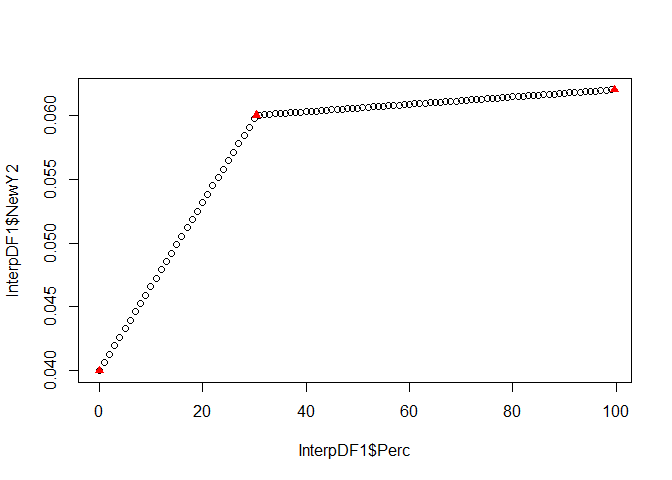
Percent <- c(0,30.4,99.6)
Value1 <- c(100,80.4,70)
Value2 <- c(0.04,0.06, 0.062)
DF1 <- data.frame(Percent,Value1,Value2)
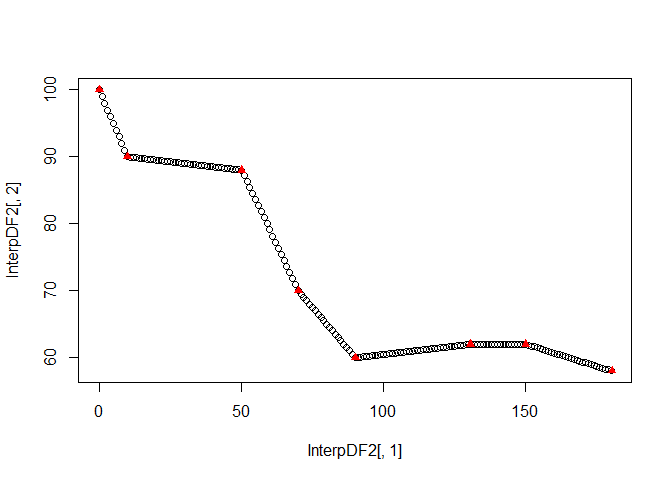
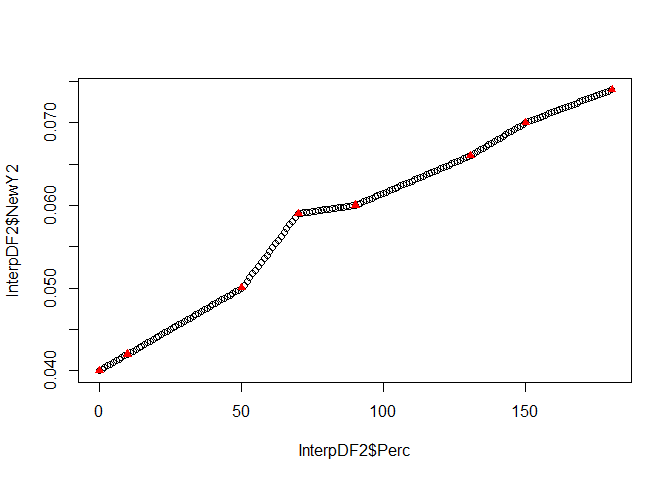
Percent_A <- c(0,10,50.2,70,90.1,130.6,150,180.3)
Value1_A <- c(100,90,88,70,60,62,62,58)
Value2_A <- c(0.04,0.042,0.05,0.059,0.06,0.066,0.07,0.074)
DF2 <- data.frame(Percent_A, Value1_A, Value2_A)
'''
I would like to interpolate these data frames (in reality I have many of these data frames, so it would be ideal if I can use one approach to deal with all data frames). I have some basic understanding of interpolation in R but am running into a couple of problems.
-
I would like these data frames to be interpolated into new data frames with y values given for every single-percentage value. This is causing me issues for two reasons (1: the data frames have two different max(Percent) values; 2: max(Percent) values are frequently not whole numbers). Based on my limited interpolation in R knowledge, the approxfun function seems useful, but I am unsure how to interpolate into every 1 percentage units, where the max known percentage value is not a whole number.
-
It would be great if I could interpolate Value1 and Value2 (in relation to Percent) for a given DF at the same time.
I would love your knowledge and insight on this matter! Thank you for the time and consideration on this topic.