Hello everyone, I am an absolute beginner in R and I need to plot a map. There are 23 stations, each having its own Chlorophyll and POC concentration. I have already created separate maps to visualize each of them, but now I want to merge them into one map. My idea is to create a kind of pie chart, but with two 180° pieces, each representing the concentration of one parameter. I will attach a picture so you know roughly what I mean
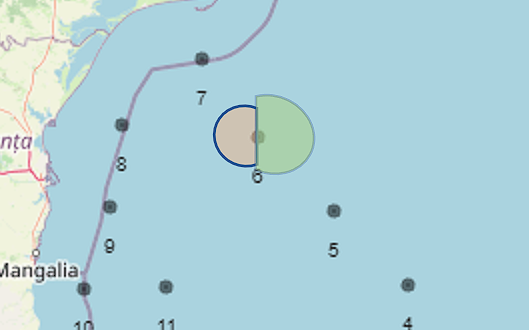
. I know my code might be very messy, but I am also sure that you are absolute experts who can easily help me. Thank you so much for your time
Here is the code:
Install necessary packages
install.packages(c("leaflet", "leaflet.extras"))
install.packages("leaflet", dependencies = TRUE)
library(leaflet)
library(leaflet.extras)
Define the bounding box for the map
bbox <- c(27.3175, 45.0270, 31.1353, 42.1512)
Create the map with specified bounding box and zoom level
map <- leaflet() %>%
setView(lng = mean(bbox[c(1,3)]), lat = mean(bbox[c(2,4)]), zoom = 7)
Add Esri.WorldStreetMap base map layer
map <- addProviderTiles(map, "Esri.WorldStreetMap")
Define station locations and labels
stations <- data.frame(
Station = c("Station 8", "Station 7", "Station 6", "Station 5", "Station 4", "Station 3", "Station 2", "Station 1", "Station 13", "Station 12", "Station 11", "Station 9", "Station 10", "Station 16", "Station 15", "Station 14", "Station 21", "Station 22", "Station 23", "Station 20", "Station 19", "Station 18", "Station 17"),
long = c(29.0593, 29.4931, 29.8046, 30.222, 30.6313, 31.0487, 30.7181, 30.3726, 30.0219, 29.6561, 29.3039, 28.9946, 28.8547, 28.6702, 28.9928, 29.3182, 29.6485, 29.3519, 29.0614, 28.7411, 28.4157, 28.1245, 28.3701),
lat = c(44.32, 44.582, 44.2751, 43.9838, 43.6896, 43.3843, 43.1525, 42.9122, 43.1689, 43.422, 43.685, 43.9986, 43.679, 43.3745, 43.1322, 42.8885, 42.6369, 42.4347, 42.2345, 42.4821, 42.7321, 42.9688, 43.2165)
)
Create a new column with just the station number
stations$StationNum <- gsub("Station ", "", stations$Station)
Add black points for each station
map <- addCircleMarkers(map, stations$long, stations$lat, color = "black", radius = 0.01, label = stations$StationNum, labelOptions = labelOptions(noHide = TRUE, textOnly = TRUE, direction = "bottom"))
Define chlorophyll data frame
chlorophyll_df <- data.frame(
station = c("Station 8", "Station 7", "Station 6", "Station 5", "Station 4", "Station 3", "Station 2", "Station 1", "Station 13", "Station 12", "Station 11", "Station 9", "Station 10", "Station 16", "Station 15", "Station 14", "Station 21", "Station 22", "Station 23", "Station 20", "Station 19", "Station 18", "Station 17"),
chlorophyll = c(0.34, 0.28, 0.253, 0.2, 0.193, 0.313, 2.373, 1.26, 0.497, 0.28, 0.167, 0.197, 0.157, 0.227, 0.173, 0.873, 0.397, 0.903, 0.125, 0.19, 0.137, 0.225, 0.183)
)
Define POC data frame
POC_df <- data.frame(
station = c("Station 8", "Station 7", "Station 6", "Station 5", "Station 4", "Station 3", "Station 2", "Station 1", "Station 13", "Station 12", "Station 11", "Station 9", "Station 10", "Station 16", "Station 15", "Station 14", "Station 21", "Station 22", "Station 23", "Station 20", "Station 19", "Station 18", "Station 17"),
POC = c(0.17, 0.14, 0.1265, 0.1, 0.0965, 0.1565, 1.1865, 0.63, 0.2485, 0.14, 0.0835, 0.0985, 0.0785, 0.1135, 0.0865, 0.4365, 0.1985, 0.4515, 0.0625, 0.095, 0.0685, 0.1125, 0.0915)
)
Add circle markers with different sizes and colors based on the type and chlorophyll concentration
map <- map %>% addCircleMarkers(
data = chlorophyll_df,
lat = ~df$lat[match(chlorophyll_df$station, df$name)],
lng = ~df$lng[match(chlorophyll_df$station, df$name)],
radius = ~sqrt(chlorophyll_df$chlorophyll)*15,
color = "green",
stroke = FALSE,
fillOpacity = 0.25,
popup = ~paste("Chlorophyll: ", chlorophyll_df$chlorophyll)
)
Display the map
map