Hi, the order of months in below plot shifts by one month going from group "a" (starts Jan) to "b" (starts Feb) to "c". (starts Mar).
require(RColorBrewer)
require(lubridate)
data <- runif(36, 1,6)
info<-matrix(data,12,3)
print(info)
rownames(info)<-factor(month(1:12), levels=1:12, labels=month.abb, ordered=TRUE)
colnames(info)<-c("a","b","c")
barplot(info,beside=T,col=brewer.pal(n = 12, name = "RdBu"),legend=rownames(info),args.legend = list(x="bottomright", inset = c(-0.25, 0)))
I am puzzled why this is happening as I've another similar example without months whether each group is in same order.
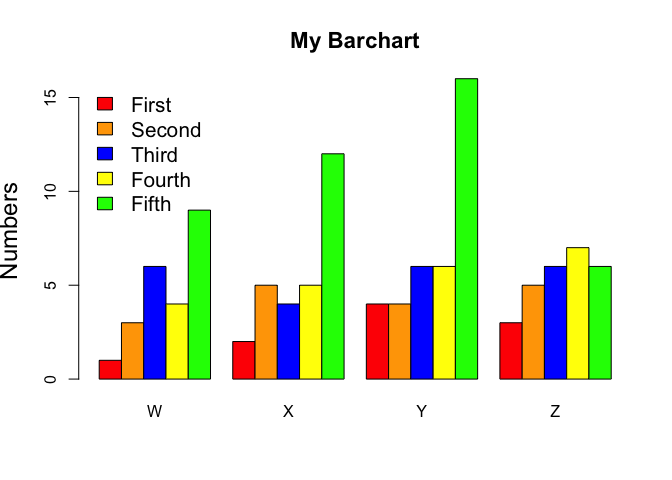
data <- structure(list(W= c(1L, 3L, 6L, 4L, 9L), X = c(2L, 5L,
4L, 5L, 12L), Y = c(4L, 4L, 6L, 6L, 16L), Z = c(3L, 5L,
6L, 7L, 6L)), .Names = c("W", "X", "Y", "Z"), class = "data.frame", row.names = c(NA, -5L))
attach(data)
print(data)
colours <- c("red", "orange", "blue", "yellow", "green")
barplot(as.matrix(data), main="My Barchart", ylab = "Numbers", cex.lab = 1.5, cex.main = 1.4, beside=TRUE, col=colours)
legend("topleft", c("First","Second","Third","Fourth","Fifth"), cex=1.3, bty="n", fill=colours)
(source: https://www.theanalysisfactor.com/r-11-bar-charts/)
Please tell me why first R code leads to a shifting of the columns in each group whereas in the second example it doesnt?