R displays labels instead of levels of factors in dataframe

This is my dataframe and code:

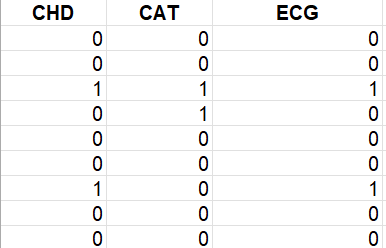
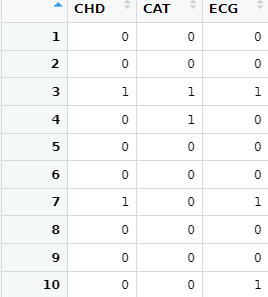
bazza <- structure(list(CHD = c(0, 0, 1, 0, 0, 0, 1, 0, 0, 0, 0, 0, 0, 
0, 0, 1, 0, 0, 0, 0), CAT = c(0, 0, 1, 1, 0, 0, 0, 0, 0, 0, 0, 
0, 0, 0, 0, 1, 0, 1, 0, 0), ECG = c(0, 0, 1, 0, 0, 0, 1, 0, 0, 
1, 0, 0, 0, 0, 0, 1, 0, 1, 0, 1)), class = c("tbl_df", "tbl", 
"data.frame"), row.names = c(NA, -20L))

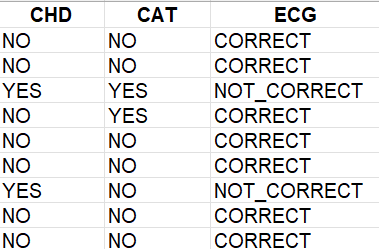
bazza$CHD <- factor(bazza$CHD, levels = c(0, 1), labels = c("NO", "YES"))

bazza$CAT <- factor(bazza$CAT, levels = c(0, 1), labels = c("NO", "YES"))

bazza$ECG <- factor(bazza$ECG, levels = c(0, 1), labels = c("NO_Pra", "YES_Niepr"))

After converting variables to factors RStudio displays labels instead of levels:

obraz

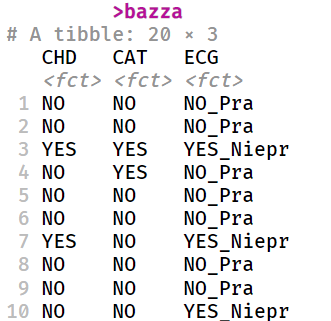
What to do to keep it like this dataframe below and still have got variables as factors ?

obraz

Strangely if I run:

>levels(bazza$CAT)
[1] "NO"  "YES"

I set up levels as 0 and 1 not NO and YES - these are factor labels. Can someone explain that behaviour ?

It seems that using the labels argument replaces the levels with the labels. No matter what the levels and labels are, they are mapped to integer values starting with 1.
Here are some examples that I hope will clarify what is happening.

#Standard case, levels is set to as.character(unique(x))
DF4 <- data.frame(W = factor( x = c(1,0,0,1)),
                  Value = 11:14)
DF4
#>   W Value
#> 1 1    11
#> 2 0    12
#> 3 0    13
#> 4 1    14
as.numeric(DF4$W)
#> [1] 2 1 1 2
as.character(DF4$W)
#> [1] "1" "0" "0" "1"
levels(DF4$W)
#> [1] "0" "1"

#Using levels and labels effectively replaces the levels with the labels
DF <- data.frame(W = factor( x = c(1,0,0,1),levels = c(0,1),
                            labels = c("Woo","Hoo")),
                 Value = 11:14)
DF
#>     W Value
#> 1 Hoo    11
#> 2 Woo    12
#> 3 Woo    13
#> 4 Hoo    14

as.numeric(DF$W)
#> [1] 2 1 1 2
as.character(DF$W)
#> [1] "Hoo" "Woo" "Woo" "Hoo"
levels(DF$W)
#> [1] "Woo" "Hoo"

#If levels are used but they match unique(x), the result is the same
#as the default behavior
DF2 <- data.frame(W = factor( x = c(1,0,0,1),levels = c(0,1)),
                 Value = 11:14)
DF2
#>   W Value
#> 1 1    11
#> 2 0    12
#> 3 0    13
#> 4 1    14
as.numeric(DF2$W)
#> [1] 2 1 1 2
as.character(DF2$W)
#> [1] "1" "0" "0" "1"
levels(DF2$W)
#> [1] "0" "1"

#There can be levels with no memebers in the data
DF3 <- data.frame(W = factor( x = c(1,0,0,1),levels = c("0","1","nope")),
                  Value = 11:14)
DF3
#>   W Value
#> 1 1    11
#> 2 0    12
#> 3 0    13
#> 4 1    14
as.numeric(DF3$W)
#> [1] 2 1 1 2
as.character(DF3$W)
#> [1] "1" "0" "0" "1"
levels(DF3$W)
#> [1] "0"    "1"    "nope"

Created on 2022-09-16 with reprex v2.0.2

Thank you, I am thinking about something (code) that allows me to "switch" between numbers and strings/labels (factors), something like in SPSS.

obraz

From that into this and vice versa:

obraz

And my second question is how to aggregate this into contingency table like that:

obraz

and un-aggregate it back again.

This topic was automatically closed 42 days after the last reply. New replies are no longer allowed.

If you have a query related to it or one of the replies, start a new topic and refer back with a link.