Hi!
Is there anybody who knows what package I need to use to see a R console table by the Viewer or as an image?
I have this example:
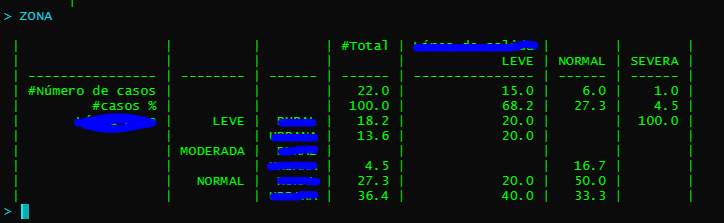
how can I export it as an image or render it in LaTeX or in HTML without losing its form? Is it possible?
Hi!
Is there anybody who knows what package I need to use to see a R console table by the Viewer or as an image?
I have this example:
how can I export it as an image or render it in LaTeX or in HTML without losing its form? Is it possible?
Hi,
I think you can just use Rmarkdown for that right?
If not, please provide us with some code that actually generates a table like this so we can explore other options.
Hope this helps,
PJ
Hi,
R Markdown works passably, but I would like to know if there is a package that makes it possible without using R Markdown. I want to see the result in the Viewer, as a plot.
This is an example code:
table1 = tibble::tibble(x = c('H', 'L', 'M', 'M', 'L', 'H'),
                        y = c('L', 'M', 'L', 'M', 'H', 'L'))
expss::calculate(table1, expss::cro_cpct(x,
                        list(expss::total(), y),
                        total_row_position = "above",
                        total_label = c("Número de casos", "casos %"),
                        total_statistic = c("u_cases", "u_rpct")
))
Hi,
I know this is not perfect, but I had some fun trying to come up with a workaround to capture the output as HTML as you requested:
library(expss)

#Create the data
table1 = tibble::tibble(x = c('H', 'L', 'M', 'M', 'L', 'H'),
                        y = c('L', 'M', 'L', 'M', 'H', 'L'))

myTable = expss::calculate(
  table1, expss::cro_cpct(x,
                          list(expss::total(), y),
                          total_row_position = "above",
                          total_label = c("Número de casos", "casos %"),
                          total_statistic = c("u_cases", "u_rpct")
  ))

#Capture the console output
myTable = capture.output(myTable)

#Write it to HTML
write(paste0(
  "<html><body>\n<pre>",
  paste(myTable[-1], collapse = "<pre>\n<pre>"),
  "<pre>\n</body></html>"),
  "myTable.html")

#View it
rstudioapi::viewer("myTable.html")
Created on 2021-02-11 by the reprex package (v1.0.0)
What it does is captures the output as lines of text, then pasting it into HTML format. The use of the <pre> tag makes sure that the tabs are respected in HTML.
Let me know what you think,
PJ
| | | #Total | H | L | M || - | ---------------- | ------ | ----- | ---- | ---- || x | #Número de casos | 6.0 | 1.0 | 3.0 | 2.0 || | #casos % | 100.0 | 16.7 | 50.0 | 33.3 || | H | 33.3 | | 66.7 | || | L | 33.3 | 100.0 | | 50.0 || | M | 33.3 | | 33.3 | 50.0 |
It's awesome! I hadn't ever thought about a solution like this. It's not what I expected, but it's a good beginning. I think you gave me the solution.
Thanks!
This topic was automatically closed 7 days after the last reply. New replies are no longer allowed.
If you have a query related to it or one of the replies, start a new topic and refer back with a link.