Executing the code in both Ubuntu and Windows
library(purrr)
library(gt)

df <- structure(list(Ratio_Bin = structure(c(1L, 2L, 3L, 4L, 5L, 7L
), levels = c("[-Inf,0.4]", "(0.4,0.7]", "(0.7,0.8]", "(0.8,0.95]",
              "(0.95, Inf]", "[0.95, Inf)", "Missing", "[-Inf,0.4)", "[0.4,0.7)",
              "[0.7,0.8)", "[0.8,0.95)"), class = c("ordered", "factor")),
`Group1|Coef` = c(0.0286, 0.0102, 0.0104, 0.0103, 0.0122, 0.0186),
`Group1|Count` = c(12811L, 58036L, 53731L, 20288L, 34157L, 58111L),
`Group1|Prop` = c(0.054, 0.2447, 0.2266, 0.0856, 0.144, 0.2451),
`Group2|Coef` = c(0.0015, 0.0015, 0.0008, 0.0018, 0.0025, 0.001),
`Group2|Count` = c(30823L, 51833L, 8279L, 18079L, 24192L, 318514L),
`Group2|Prop` = c(0.0682, 0.1147, 0.0183, 0.04, 0.0536, 0.7051)),
row.names = c(NA, -6L), class = "data.frame")

df |> gt::gt() |>
  gt::tab_header( title = gt::md('Distribution of the coefficient level') ) |>
  gt::tab_spanner_delim(delim = '|') |>
  gt::fmt_percent(columns = tidyselect:::where(is.double)) |>
  gt::fmt_integer(columns = tidyselect:::where(is.integer), sep_mark = " ") |>
  gt::data_color(
    columns = gt::ends_with('Coef'),
    palette = c('green', 'orange', 'red'),
    domain = range(0, 0.05)
  )
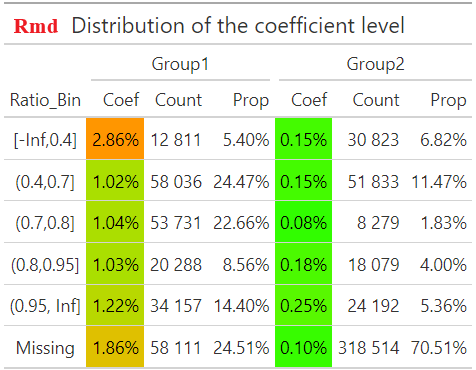
in the .Rmd file creates a {gt} table without alternating shading in rows, unless the function
gt::opt_row_striping() is used:
However, the same code executed in the .qmd file always creates a table with alternating shading in rows:
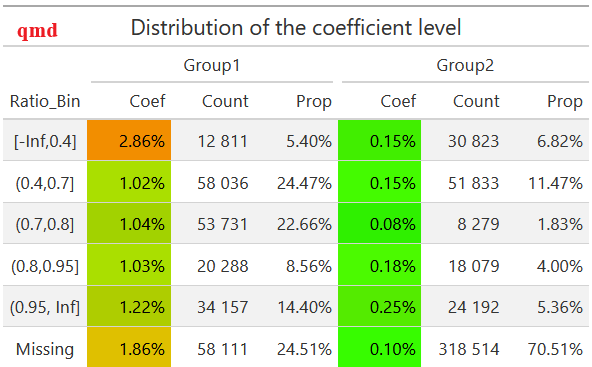
This causes confusion when creating tables with color fill using the function gt::data_color(), since cells with the same value will have different colors depending on whether the rows containing them are even or odd.
How to disable forced alternating shading in rows in {gt} tables in .qmd files?