I am glad you liked it. It is very 'basic' (from r-'base') code that is handy to know, but some people make fun at me as my code tend to be a blast from the past, over-looping etc (not to mention using emacs 99% of the time  )
)
I am curious in which area or research ofr analysis this plots are more used, I never heard of them (but I do not like much boxplots either). I found vague information in a simple search on google...
I have make some cosmetic changes to allow more easy control of the output (function code below)
Data:
set.seed(666)
Data <- data.frame(x = c(rnorm(300, mean=4, sd =1),rexp(300), rbeta(300, shape1 = .5, shape2 = .5) -2.5, c(rnorm(150,0,1.2),rnorm(150,5,1)), runif(300, -4,8)),
                   y = rep(c('a','b','c','d', 'e'), each = 300)
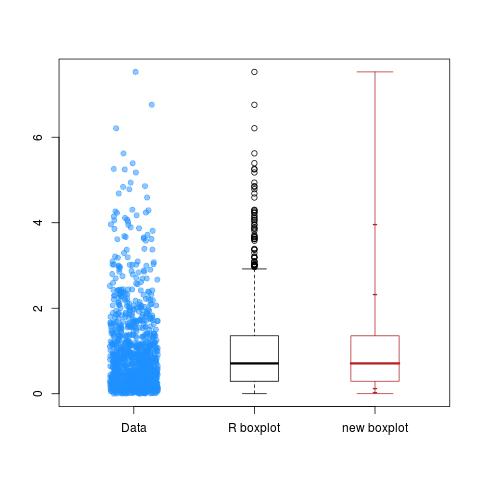
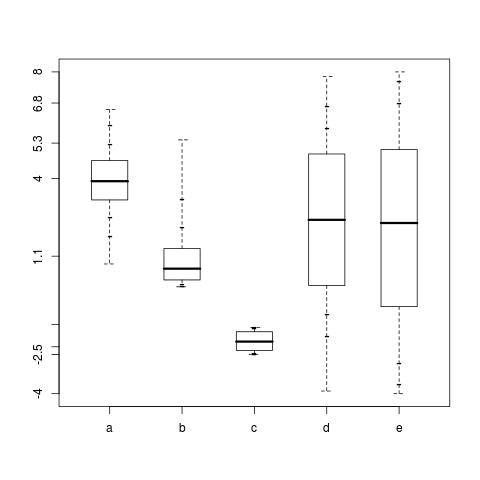
From the simplest version:
NewBoxPlot(Data$x,Data$y)
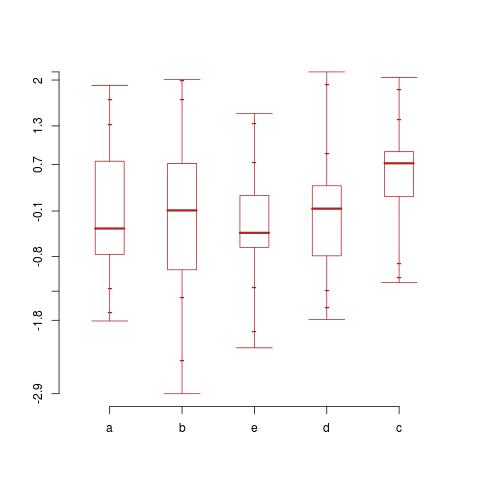
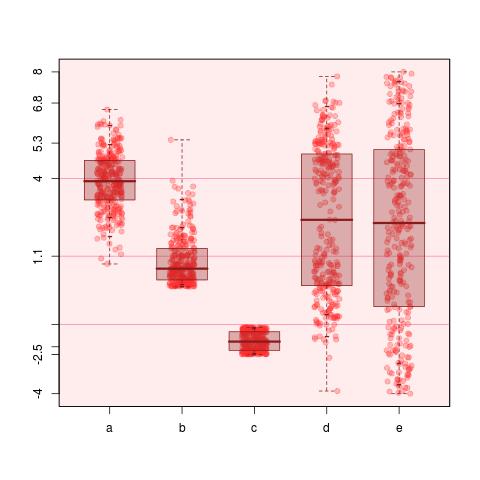
to a more fancy one:
NewBoxPlot(Data$x,Data$y, fill = TRUE, points = TRUE, width = .7,
    bg = TRUE, colbg = 'rosybrown1',colbox = 'firebrick4',
    colpoints = 'firebrick1', qdata = TRUE, qdatacol = 'palevioletred1')
I must say that in one of my screens the background colour is not appreciated (in the auxiliary, maybe the cable is partially broken?), but it is on the other, where I use to see plots, and it is the one from laptop.
the function is:
NewBoxPlot <- function(x,y, points = FALSE, bg = FALSE, colbox = 'black', colpoints = colbox, fill = FALSE,  colbg = 'gray', width = .5, qdata = FALSE, qdatacol = 'white'){
    if (width > 1)
        width = 1
    width <- width / 2
    y <- as.character(y)
    nbox <- length(unique(y))
    f <- unique(y)
    lims <- c(0 - .5, nbox -.5)
    cents <- 0:(nbox-1)
    BG <- function(){
            lbg <- par('usr')
            rect(lbg[1],lbg[3],lbg[2], lbg[4], col = adjustcolor(colbg,.3))
            if (qdata)
                abline(h = quantile(x, c(.25,.5,.75)), col = qdatacol)
    }
    labs.y <- quantile(x, c(0,.025,.1,.25,.5,.75,.9,.975,1)) # quantiles
    plot(0, xaxt = 'n', yaxt = 'n', pch = '', ylab = '', xlab = '', xlim = lims, ylim = range(x), panel.first = if (bg) {BG()})
    for (i in 1:nbox){
        xi <- x[y==f[i]]
        cent = cents[i]
        b <- quantile(xi, c(.025,.1,.25,.5,.75,.9,.975)) # quantiles
        mima <- range(xi)                        # max and min
        if (points)
            points(cent + runif(length(xi), -width/2, width/2), xi, pch = 19, col = adjustcolor(colpoints, .3))
        rect(cent - width, b[3], cent + width, b[5], border = colbox, col = if (fill) {adjustcolor(colbox, .3)})
        points(cent + c(-width,width), c(b[4], b[4]), type = 'l', col = colbox, lwd = 3)
        arrows(cent, b[5], cent, mima[2], col = colbox, angle = 90, lty = 2, length = .3*width)
        arrows(cent, b[3], cent, mima[1], col = colbox, angle = 90, lty = 2, length = .3*width)
        points(rep(cent, 4), b[c(1,2,6,7)], pch = '-', cex = 1.5, col = colbox)
    }
    axis(side = 1, at = cents, labels = f)
    axis(side = 2, at = labs.y, labels = round(labs.y,1))
}
and I am happy to finish a roxy skeleton for having a help file if you think it can have some use 
cheers
Fer