Quantico
Authors: Adrian Antico
Abstract: Quantico is a Shiny App for data science, analytics, and business intelligence. The app is non-reactive where big data can cause a poor user experience. All data operations utilize data.table for fast processing and low memory utilization. Visualizations are based on the echarts4r library, machine learning algorithms currently include CatBoost, XGBoost, LightGBM, and some of the H2O models. Time series models are based on the forecast package. Panel forecast models are ML-backed and can utilize CatBoost, XGBoost, or LightGBM. Data can be accessed via PostGRE or locally (currently), and session saving and restoration is available. There are 15 different colored app themes along with the inclusion of various background images if a user wants to zone out for a bit.
Full Description: Quantico is a Shiny App for data science, analytics, and business intelligence. The app is non-reactive where big data can cause a poor user experience. All data operations utilize data.table for fast processing and low memory utilization. Visualizations are based on the echarts4r library, machine learning algorithms currently include CatBoost, XGBoost, LightGBM, and some of the H2O models. Time series models are based on the forecast package. Panel forecast models are ML-backed and can utilize CatBoost, XGBoost, or LightGBM. Data can be accessed via PostGRE or locally (currently), and session saving and restoration is available. There are 15 different colored app themes along with the inclusion of various background images if a user wants to zone out for a bit.
The fundamental goal of Quantico is to make life easier. While there are several GUI's available in the R ecosystem, I haven't found one that really serves my needs. I want to be able to explore data quickly and produce results that can be shared across an organization, as an example. Some of the tasks can take anywhere from an hour to a full day in a typical coding environment (possibly more or less dependent upon one's skills of course) while they can be produced within minutes with Quantico. Another aspect is handling big data. The data.table package is utilized and can process big data quickly while keeping your memory footprint small, thus enabling larger datasets to be managed within the app for a given device. Lastly, I would like to be able to transition from an in-app experience to a coding environment with ease, which is handled nicely with the code generation part of the app. If I need to take something to the next level that the app doesn't support, I can grab the code and pick up where I left off in my favorite IDE.
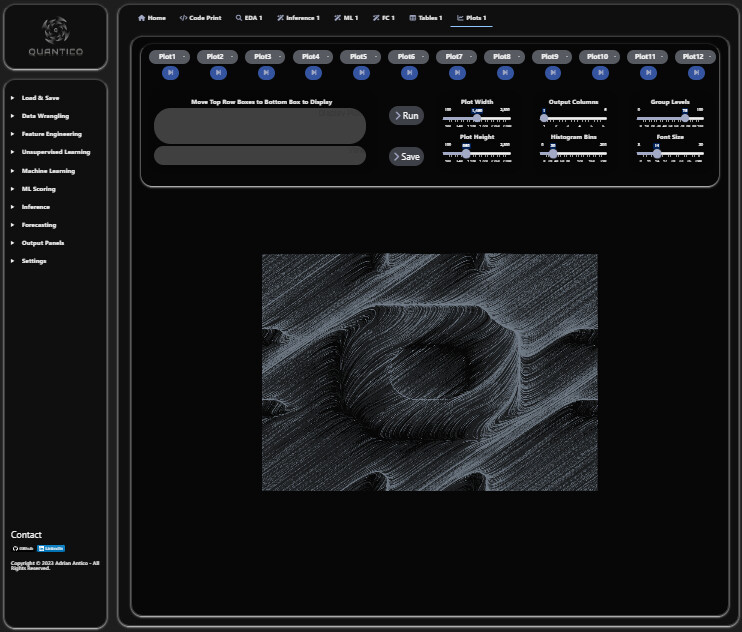
The primary goals of the app design are to make it easy and fast to use, and to create a look and feel that is fun to use. The way the app layout works is that the sidebar is predominantly intended for setting up inputs and running various tasks (aside from the settings options) while the main panel is for displaying various outputs. With this design, I am able to maximize the space available for viewing output.
The GitHub README contains a comprehensive overview of the entire applications functionality. GitHub - AdrianAntico/Quantico: Shiny App for Echarts Viz, ML, Forecasting, Data Wrangling, Feature Engineering, Inference, and Code Generation
P.S. The app is intended to be used for data science and analytics work. Thus, data isn't part of the app. However, if you need some data to explore that app, there is a dataset available at Benchmarks/Data at main · AdrianAntico/Benchmarks · GitHub called FakeBevData.csv. This dataset was used to create most of the examples in the Quantico README and documentation within the app.
Shiny app: https://the_app_isn't_deployed
Repo: GitHub - AdrianAntico/Quantico: Shiny App for Echarts Viz, ML, Forecasting, Data Wrangling, Feature Engineering, Inference, and Code Generation
Thumbnail:
Full image: