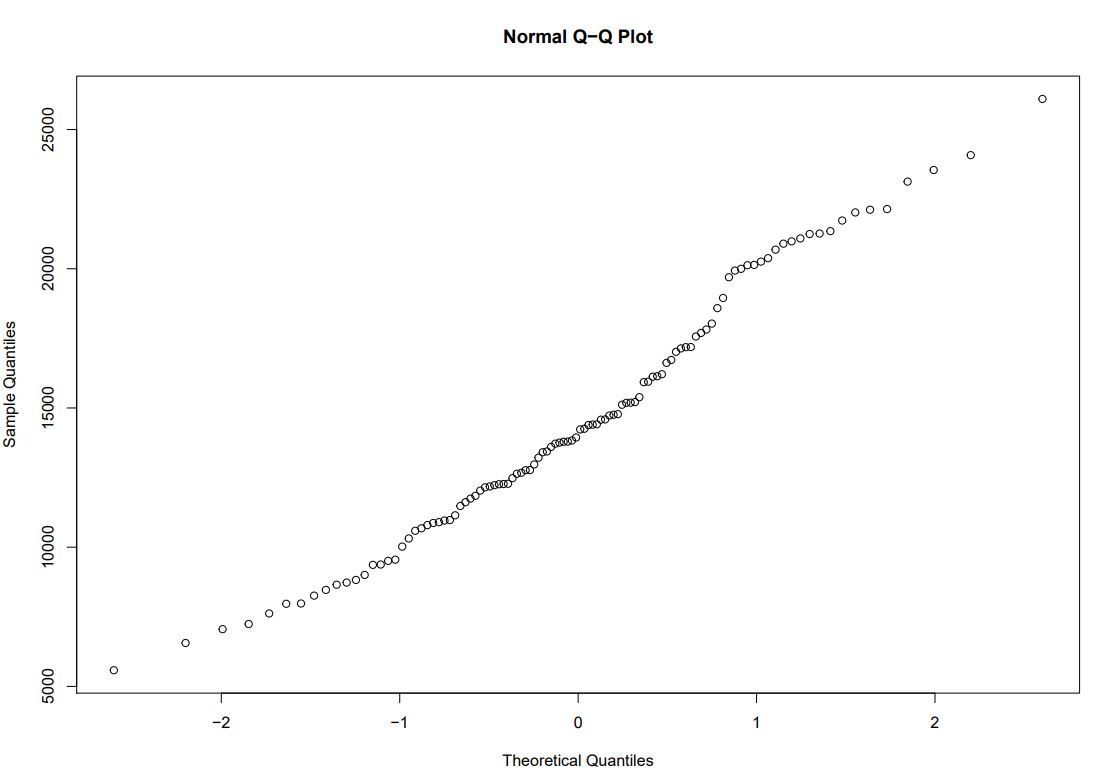
I have a time series of 108 data points and I plotted a normality plot to see if the residuals fit a normal distribution, and there is no line on the plot. How would I go about adding one in?
Thanks
To help us help you, could you please prepare a reproducible example (reprex) illustrating your issue? Please have a look at this guide, to see how to create one: