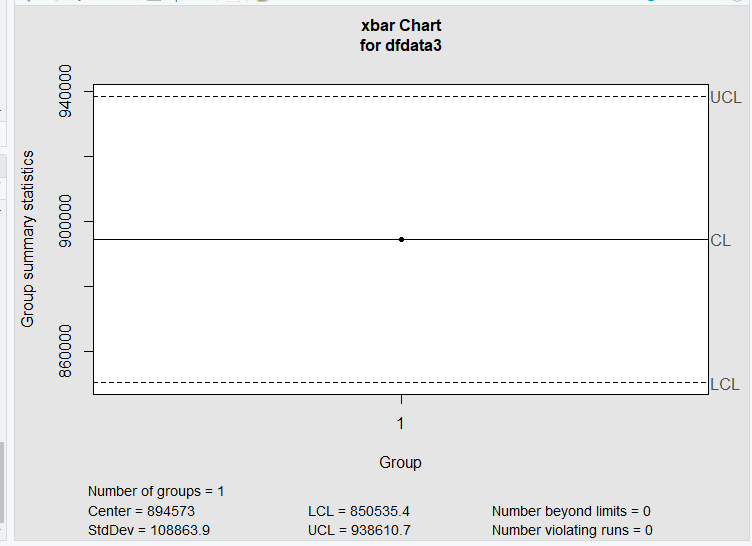
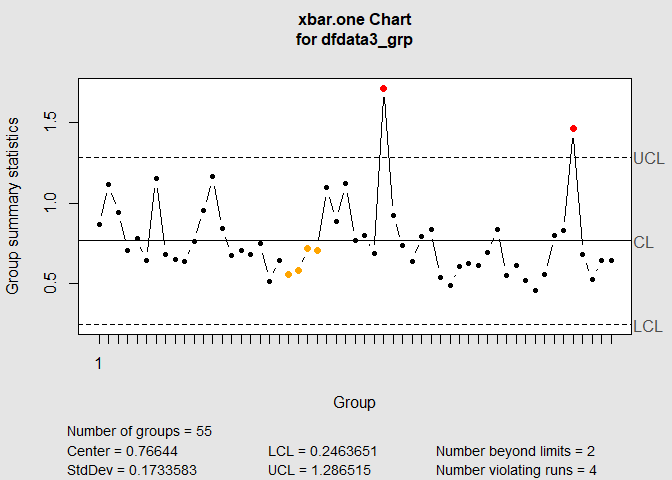
I changed the order of the arguments in qcc.groups and I changed the type of plot from xbar to xbar.one. You only have one measurement per Batch.Name.
dfdata3 <- structure(list(Batch.Name = c(709193, 727237, 735888, 739385,
                                         744463, 754696, 758427, 764049, 767737, 773521, 775288, 779685,
                                         783587, 789615, 793264, 793267, 799742, 805242, 806944, 817990,
                                         834100, 839833, 840997, 844117, 899453, 901736, 902704, 909566,
                                         932314, 938959, 943670, 949107, 949108, 958033, 960403, 965089,
                                         965094, 969527, 974089, 975530, 985677, 993664, 995169, 999804,
                                         999806, 1014045, 1016961, 1022456, 1031359, 1031360, 1031363,
                                         1044422, 1044423, 1056867, 1061492),
                          Result.Display.Name = c("Acidic",
                                                  "Acidic", "Acidic", "Acidic", "Acidic", "Acidic", "Acidic", "Acidic",
                                                  "Acidic", "Acidic", "Acidic", "Acidic", "Acidic", "Acidic", "Acidic",
                                                  "Acidic", "Acidic", "Acidic", "Acidic", "Acidic", "Acidic", "Acidic",
                                                  "Acidic", "Acidic", "Acidic", "Acidic", "Acidic", "Acidic", "Acidic",
                                                  "Acidic", "Acidic", "Acidic", "Acidic", "Acidic", "Acidic", "Acidic",
                                                  "Acidic", "Acidic", "Acidic", "Acidic", "Acidic", "Acidic", "Acidic",
                                                  "Acidic", "Acidic", "Acidic", "Acidic", "Acidic", "Acidic", "Acidic",
                                                  "Acidic", "Acidic", "Acidic", "Acidic", "Acidic"),
                          Raw.Number = c(0.8663,
                                         1.1192, 0.9437, 0.7085, 0.7795, 0.6441, 1.1545, 0.6833, 0.6501,
                                         0.6356, 0.76, 0.9555, 1.1653, 0.8426, 0.6744, 0.7051, 0.68, 0.7491,
                                         0.5169, 0.6475, 0.558, 0.5824, 0.7212, 0.7082, 1.096, 0.8891,
                                         1.1216, 0.7707, 0.7974, 0.6866, 1.7159, 0.9256, 0.7399, 0.637,
                                         0.7955, 0.8347, 0.5414, 0.491, 0.6045, 0.6234, 0.6149, 0.6937,
                                         0.8356, 0.5532, 0.6118, 0.5189, 0.4556, 0.5575, 0.7982, 0.8283,
                                         1.463, 0.6836, 0.5276, 0.6439, 0.6471)),
                     row.names = c(10L, 67L,
                                   124L, 181L, 238L, 295L, 352L, 409L, 466L, 520L, 577L, 634L, 691L,
                                   748L, 805L, 862L, 919L, 976L, 1033L, 1090L, 1147L, 1204L, 1261L,
                                   1318L, 1375L, 1432L, 1489L, 1546L, 1603L, 1660L, 1717L, 1774L,
                                   1831L, 1888L, 1945L, 2002L, 2059L, 2116L, 2173L, 2230L, 2287L,
                                   2344L, 2401L, 2458L, 2515L, 2572L, 2629L, 2686L, 2743L, 2800L,
                                   2857L, 2914L, 2971L, 3028L, 3114L),
                     class = "data.frame")

library(qcc)
#> Warning: package 'qcc' was built under R version 4.1.2
#> Package 'qcc' version 2.7
#> Type 'citation("qcc")' for citing this R package in publications.
attach(dfdata3)
dfdata3_grp <- qcc.groups(Raw.Number, Batch.Name)
qcc(dfdata3_grp, type = "xbar.one")
#> List of 11
#>  $ call      : language qcc(data = dfdata3_grp, type = "xbar.one")
#>  $ type      : chr "xbar.one"
#>  $ data.name : chr "dfdata3_grp"
#>  $ data      : num [1, 1:55] 0.866 1.119 0.944 0.709 0.779 ...
#>   ..- attr(*, "dimnames")=List of 2
#>  $ statistics: Named num [1:55] 0.866 1.119 0.944 0.709 0.779 ...
#>   ..- attr(*, "names")= chr [1:55] "1" NA NA NA ...
#>  $ sizes     : int 55
#>  $ center    : num 0.766
#>  $ std.dev   : num 0.173
#>  $ nsigmas   : num 3
#>  $ limits    : num [1, 1:2] 0.246 1.287
#>   ..- attr(*, "dimnames")=List of 2
#>  $ violations:List of 2
#>  - attr(*, "class")= chr "qcc"
Created on 2022-02-24 by the reprex package (v2.0.1)