One of the use cases for Shiny dashboards in our manufacturing plant is for long-running dashboards, where a series of charts on a Shiny dashboard update on a timed interval. The client is a Chromebox that loads the dashboard from a URL to content hosted on our Posit Connect server.
Unfortunately, these deployments are failing due to severe memory leaks on the server and client side.
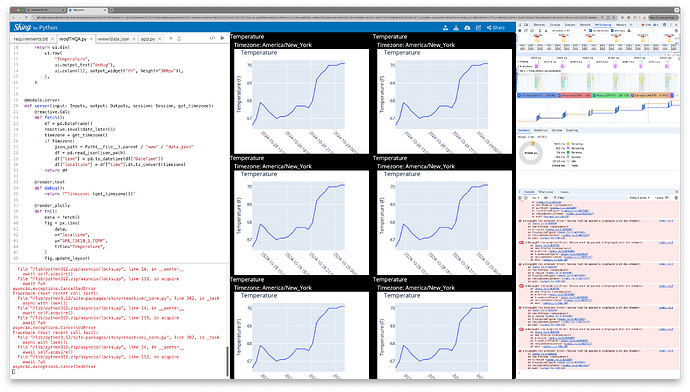
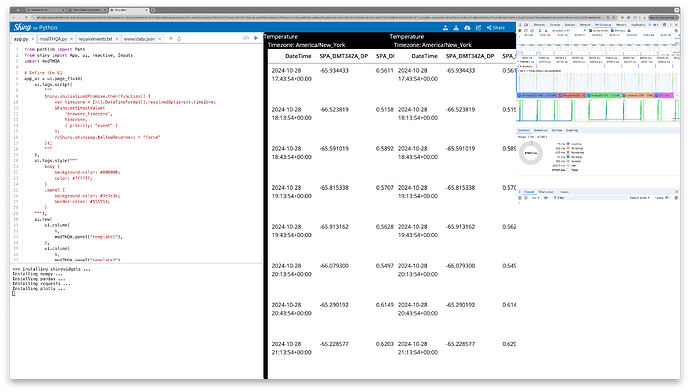
I have a simple sample app that creates a panel of six plotly charts that display some temperature data in the local browsers time zone. These charts update on a timed interval with a dataset that is provided by an internal API. For my sample program, we just load from a local JSON file.
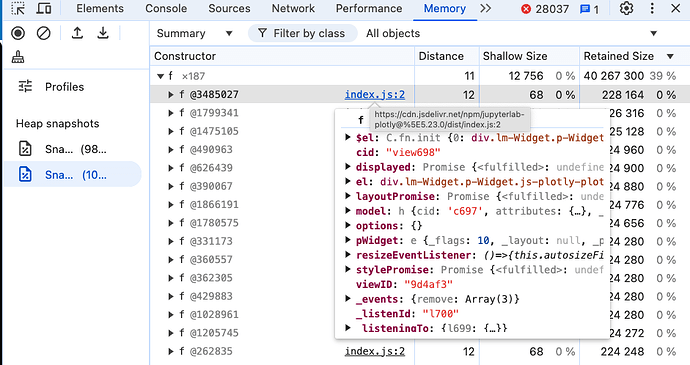
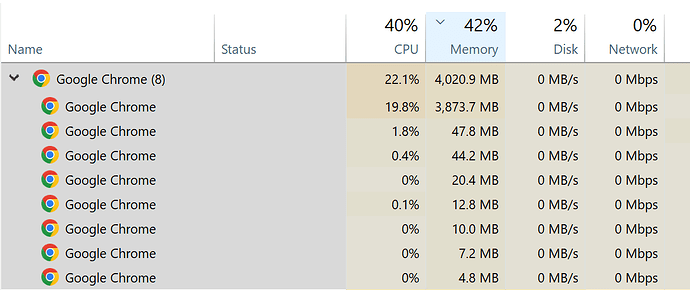
This application will result in the Microsoft Edge browser tab that hosts it accumulating 4GB of memory usage in a couple of hours and ultimately crash the browser. The server side memory creeps up from 150MB to over 1GB in the same time period.
It doesn't seem like the memory is being freed properly in these Shiny applications. I'm not sure if we can do anything differently. We previously used pure Javascript for this kind of thing and never saw these kinds of issues with memory bloat. Is there a better way to handle this in Shiny for Python?
Appreciate any advice.
Thanks,
Matt
app.py
from pathlib import Path
from shiny import App, ui, reactive, session
import modTHQA

# Define the UI
app_ui = ui.page_fluid(
    ui.tags.script("""
            Shiny.initializedPromise.then(function() {
                var timezone = Intl.DateTimeFormat().resolvedOptions().timeZone;
                Shiny.setInputValue('browser_timezone', timezone, {priority: "event"});
                //Shiny.shinyapp.$allowReconnect = "force"
            });
    """),
    ui.tags.style("""
        body {
            background-color: #000000;
            color: #ffffff;
        }
        .panel {
            background-color: #3e3e3e;
            border-color: #555555;
        }
    """),
    ui.row(
        ui.column(6,
            modTHQA.panel("template1"),
        ),
        ui.column(6,
            modTHQA.panel("template2"),
        )
    ),
    ui.row(
         ui.column(6,
            modTHQA.panel("template3"),
        ),
        ui.column(6,
            modTHQA.panel("template4"),
        )
    ),
    ui.row(
         ui.column(6,
            modTHQA.panel("template5"),
        ),
        ui.column(6,
            modTHQA.panel("template6"),
        )
    ),
)

# Define the server logic
def server(input, output, session):

    @reactive.Calc
    def get_timezone():
        timezone = input.browser_timezone()
        return timezone

    modTHQA.server("template1", get_timezone)
    modTHQA.server("template2", get_timezone)
    modTHQA.server("template3", get_timezone)
    modTHQA.server("template4", get_timezone)
    modTHQA.server("template5", get_timezone)
    modTHQA.server("template6", get_timezone)

# Create the app
app_dir = Path(__file__).parent
app = App(app_ui, server, static_assets=app_dir / "www", debug=False)

# Run the app
if __name__ == "__main__":
    app.run()
modTHQA.py
from pathlib import Path
from shiny import module, render, ui, reactive, session
from shinywidgets import output_widget, render_widget, render_plotly
import numpy as np
import pandas as pd
import requests
from datetime import datetime
import plotly.express as px

@module.ui
def panel():
    return ui.div(
        ui.row(
            "Temperature",
            ui.output_text("debug"),
            ui.column(12, output_widget("th",height="300px")),
        ),
    )

@module.server
def server(input, output, session, get_timezone):

    @reactive.Calc
    def fetch():
        df = pd.DataFrame()
        reactive.invalidate_later(10)
        timezone = get_timezone()
        if timezone:
            json_path = Path(__file__).parent / "www" / "data.json"
            df = pd.read_json(json_path)
            df["time"] = pd.to_datetime(df["DateTime"])
            df["localtime"] = df["time"].dt.tz_convert(timezone)
        return df

    @render.text
    def debug():
        return f"Timezone: {get_timezone()}"

    @output
    @render_plotly
    def th():
        data = fetch()
        fig = px.line(data, x="localtime", y="SPA_T3610_3_TEMP", title="Temperature")
        fig.update_layout(
                xaxis_title="Timestamp",
                yaxis_title="Temperature (F)",
                xaxis=dict(
                    tickformat="%Y-%m-%d %H:%M:%S",
                    tickangle=45
                )
        )
        return fig
requirements.txt
shiny==1.2.0
shinywidgets==0.3.4
numpy==2.1.3
pandas==2.2.3
requests==2.32.3
plotly==5.24.1


