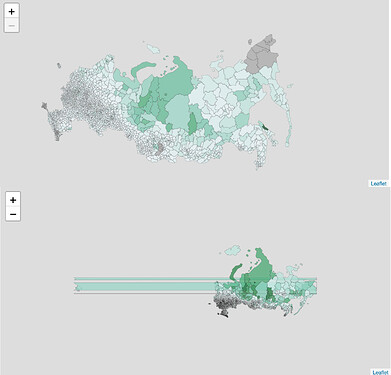
I want to combine different types of plots in one shiny app. In particular, leaflet maps and different plotly figures. This is a small working example. The problem arises with maps projection - it does not take corrections into account when the app is deployed.
First map is always rendered correctly (top figure). When I try to build new one on the same page, CRS correction fails and the map is displayed incorrectly (bottom):
When I am doing it locally on my computer in Rstudio, everything works correctly, problem is visible only after deployment.
Reproducible example and my data for it.
UI file (I preserve all packages I use in full app in case of problem with it):
options(stringsAsFactors = F)
options(scipen=999)


library(dplyr)
library(ggplot2)
library(shiny)
library(plotly)
library(sf)
library(rgeos)
library(tidyverse)
library(readr)
library(geojsonsf)
library(leaflet)
library(foreign)
library(mapview)
library(webshot)
webshot::install_phantomjs()


load('data.RData')


shinyUI(fluidPage(

  sidebarLayout(
    sidebarPanel(
      selectInput('plot_type', 'plot type:', c('map' = 'map',
                                                 'density' = 'density'), selected = 'map'),
      sliderInput("years", "year", 2010, 2018, value = 1, round = T, sep=""),

      actionButton("btn", "Figure"),
      downloadButton('downloadPlot', 'Download')
    ),

    mainPanel(
      uiOutput("plot")
        )
    )

  ))
Server file:
library(shiny)

options(stringsAsFactors = F)

load('data.RData')


shinyServer(function(input, output, session) {


  get_data = eventReactive(input$btn, {

    obj =  list(data = subset(map_data, year == input$years[1]),
                         plot_type = input$plot_type)

  })


  regPlot2 = reactive({

    plot.obj = get_data()

    if (plot.obj$plot_type == 'density'){


      p = ggplot(plot.obj$data,
                      aes_string(x = 'wage_pps')) +
                 geom_density()


    } else {

      epsg3006 <- leafletCRS(crsClass = "L.Proj.CRS", code = "EPSG: 4326",
                             proj4def = "+proj=aea +lat_1=50 +lat_2=70 +lat_0=56 +lon_0=100 +x_0=0 +y_0=0 +ellps=WGS84 +datum=WGS84 +units=m +no_defs",
                             resolutions = 2.1^(13:-1),
                             origin = c(0, 0)
      )


      pal_num <- colorNumeric(palette = "BuGn", NULL, na.color =  "#a6a6a6")

      leaflet(plot.obj$data,
                options = leafletOptions(minZoom = 0, maxZoom = 14, worldCopyJump = F, crs = epsg3006)) %>%

          addPolygons( fillColor = ~pal_num(get('wage_pps')),
                       color = "black",
                       weight = 0.3,
                       fillOpacity = 0.7,
                       popup = ~mun)

      }


  })


  output$p <- renderPlotly({
    if (get_data()$plot_type == 'density'){
      ggplotly(regPlot2())
    }
  })


  output$map <- renderLeaflet({

    if (get_data()$plot_type == 'map'){
      regPlot2()
    }
  })


  output$plot <- renderUI({

    if (get_data()$plot_type != 'map'){
            plotlyOutput("p")
          } else {
        leafletOutput("map")
      }
  })


  output$downloadPlot <- downloadHandler(

    filename = function(){paste(input$years[1], '.png',sep='')},
    content = function(file){
      if (get_data()$plot_type != 'map'){
        ggsave(file,plot=regPlot2())
    } else {
      htmlwidgets::saveWidget(regPlot2(), "temp.html", selfcontained = FALSE)
      webshot::webshot("temp.html", file = file)
    }
  },
  contentType = 'image/png'
  )

})
Interestingly, after many trials, I found that if in renderUI() I replace condition get_data()$plot_type != 'map' with input$plot_type != 'map', everything works fine even after deployment. However, I need to change plots only after button is pressed.
Can anybody help me with this problem?
