I have been working on a script that allows me to reverse-engineer Kaplan-Meier curves from published papers. These are estimates of the survival function for (in my case) patients post-treatment and are often the most detailed report of the underlying data in certain types of clinical trials. However, that data is tied up in graphical form.
One purpose of "decompiling" the graphs is to allow overlaying multiple plots, but that part by itself is easy, thanks to the awesome WebPlotDigitizer. The more difficult part is trying to calculate the actual numbers behind the curves, particularly when censoring is involved (patients dropping out of the study for non-treatment-related reasons). While I often run into graphs that require a lot of guesswork, I have been able to do a reasonable job of it.
My current script works well. However, there is one section in the middle of the data processing that seems to require a for loop. This is due to the fact that the calculation requires two variables that need values from the previous row for calculations on that row. If it was one variable, I could write it using accumulate, but accumulate can't handle multiple inputs easily.
While I'm content with the current code from a practical standpoint, the student in me wonders if there is a "tidy" way to handle this. It may be that the real answer is a need for a multiple-argument version of accumulate, similar to reduce2 or pmap. But, it may also be that I'm missing a way to handle it using existing tools.
I will say that I put together a version that was technically more "tidy" in the sense that it didn't use a for loop -- it mashed the inputs into a list that be handled by accumulate -- but the code essentially made a function that encapsulated each iteration of the for loop and then included a lot more pre- and post-processing to make it look like the results of the for loop. I'll share it if someone wants to see that I did the work (badly), but I'll leave it out to avoid melting anyone's eyes for now.
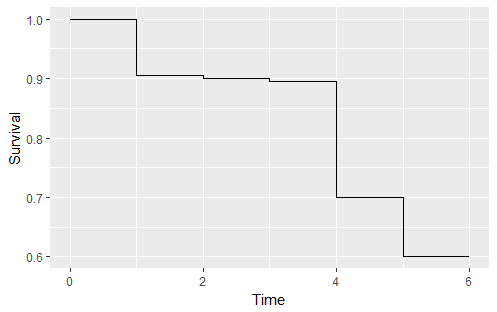
At this point in the processing, my data is essentially the cleaned Kaplan-Meier plot (see below), along with the number of people "at-risk" at each given time point. I'm trying to calculate the number of people "lost" (treatment failed) when the graph drops. In some cases, because I'm often dealing with insufficient resolution, a drop may not indicate even one lost patient (when rounded), so I don't want to treat it as an actual change. However, if multiple drops round to zero by themselves, added together they could mean at least one real patient loss. So, I carry forward the last "corrected" survival number, along with the total people lost for the reverse Kaplan-Meier calculation.

If anyone wants to take a shot at the actual code, my reprex of the section with the for loop is below, showing the expected output. I'm also open to suggestions that just point me in the right direction, as well!
# Sample pre - processed data
df <- df_orig <-
  structure(
    list(
      Time = c(0, 1, 1, 2, 2, 3, 3, 4, 4, 5, 5, 6),
      Survival = c(1, 1, 0.905, 0.905, 0.90, 0.90, 0.895, 0.895, .7, .7, .6, .6),
      Uncensored_Total = c(100, 95, 95, 85, 85, 85, 85, 85, 85, 70, 70, 50)
    ),
    .Names = c("Time", "Survival", "Uncensored_Total"),
    class = c("tbl_df", "tbl", "data.frame"),
    row.names = c(NA, -12L)
  )

# Add columns for data output
df$Lost <- c(0, rep(NA, nrow(df) - 1))
df$Actual_Survival <- c(1, rep(NA, nrow(df) - 1))

# Initial values for variables carried forward
actual_survival <- 1
total_lost <- 0

for (i in 2:nrow(df)) {
  # Creating temporary variables to make calculations readable
  survival <- df$Survival[i]
  uncensored_total <- df$Uncensored_Total[i]

  # Calculate the additional lost, rounded
  lost <-
    round((uncensored_total - total_lost) * (1 - survival / actual_survival))

  # If lost == 0, these values will be unchanged
  actual_survival <-
    (1 - lost / (uncensored_total - total_lost)) * actual_survival
  total_lost <- total_lost + lost

  # Add results to data frame
  df[i, "Lost"] <- lost
  df[i, "Actual_Survival"] <- actual_survival
}

df
#>    Time Survival Uncensored_Total Lost Actual_Survival
#> 1     0    1.000              100    0       1.0000000
#> 2     1    1.000               95    0       1.0000000
#> 3     1    0.905               95    9       0.9052632
#> 4     2    0.905               85    0       0.9052632
#> 5     2    0.900               85    0       0.9052632
#> 6     3    0.900               85    0       0.9052632
#> 7     3    0.895               85    1       0.8933518
#> 8     4    0.895               85    0       0.8933518
#> 9     4    0.700               85   16       0.7027701
#> 10    5    0.700               70    0       0.7027701
#> 11    5    0.600               70    6       0.6069378
#> 12    6    0.600               50    0       0.6069378
