Hello everyone!
First of all, I apologize for my terrible English (it is not my native language).
Well, I really need the help of one of you, please!
I am having a very big problem with the generation of graphs for correlating two variables. In fact, when I need to add the trendline.
In the correlations script (below), there are four correlations using Spearman's coefficient.
Three are showing results where the rho is positive and the graph generated shows the correlations and the trendline as expected.
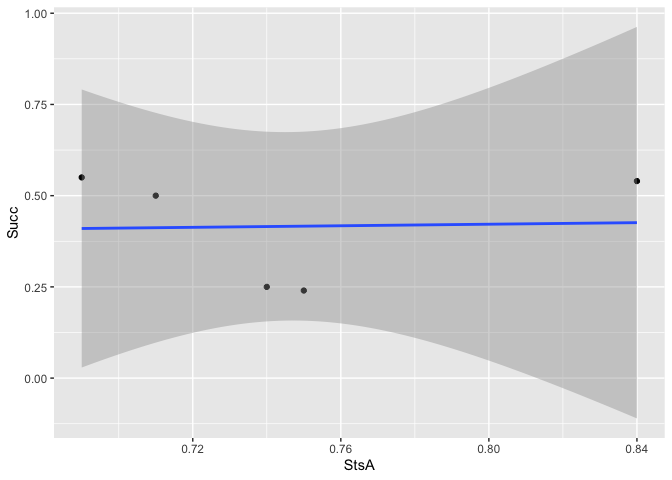
However, in one of the correlations (StsA x Succ, the first) the result of the Spearman coefficient is negative (rho = -0.4), so the trendline should be decreasing in the graph. Am I right?
It happens that when I add the line, it is introduced in the graph in a (slightly) increasing way.
Where am I going wrong? can anybody help me?
Hug! ![]()
#StsA x Succ
StsA=c(0.75, 0.74, 0.84, 0.69, 0.71)
Succ=c(0.24, 0.25, 0.54, 0.55, 0.50)
cor.test(StsA,Succ,method="spearman")
plot(StsA,Succ)
lm(Succ ~ StsA)
abline(lm(Succ ~ StsA)) #"Problem" is here! Rho=-0,4 line decreasing, right?

#InsA x Insu
InsA=c(0.07, 0.04, 0.06, 0.03, 0.05)
Insu=c(0.75, 0.74, 0.45, 0.44, 0.49)
cor.test(InsA,Insu,method="spearman")
plot(InsA,Insu)
lm(Insu ~ InsA)
abline(lm(Insu ~ InsA))

#StsB x Succ
StsB=c(0.67, 0.65, 0.78, 0.76, 0.72)
Succ=c(0.24, 0.25, 0.54, 0.55, 0.50)
cor.test(StsB,Succ,method="spearman")
plot(StsB,Succ)
lm(Succ ~ StsB)
abline(lm(Succ ~ StsB))

#InsB x Insu
InsB=c(0.10, 0.11, 0.03, 0.01, 0.05)
Insu=c(0.75, 0.74, 0.45, 0.44, 0.49)
cor.test(InsB,Insu,method="spearman")
plot(InsB,Insu)
lm(Insu ~ InsB)
abline(lm(Insu ~ InsB))