I need to run a t-test in order to compare the means of two variables in a graph. My null hypothesis is that the means are equal. My alternative hypothesis is that the mean value of the variable "Amazon.Return" is greater than the mean value of the variable "Google.Return".
I have tried to run the t test a few different ways, but I haven't been able to get it to work. Any help would be appreciated. Thank you!
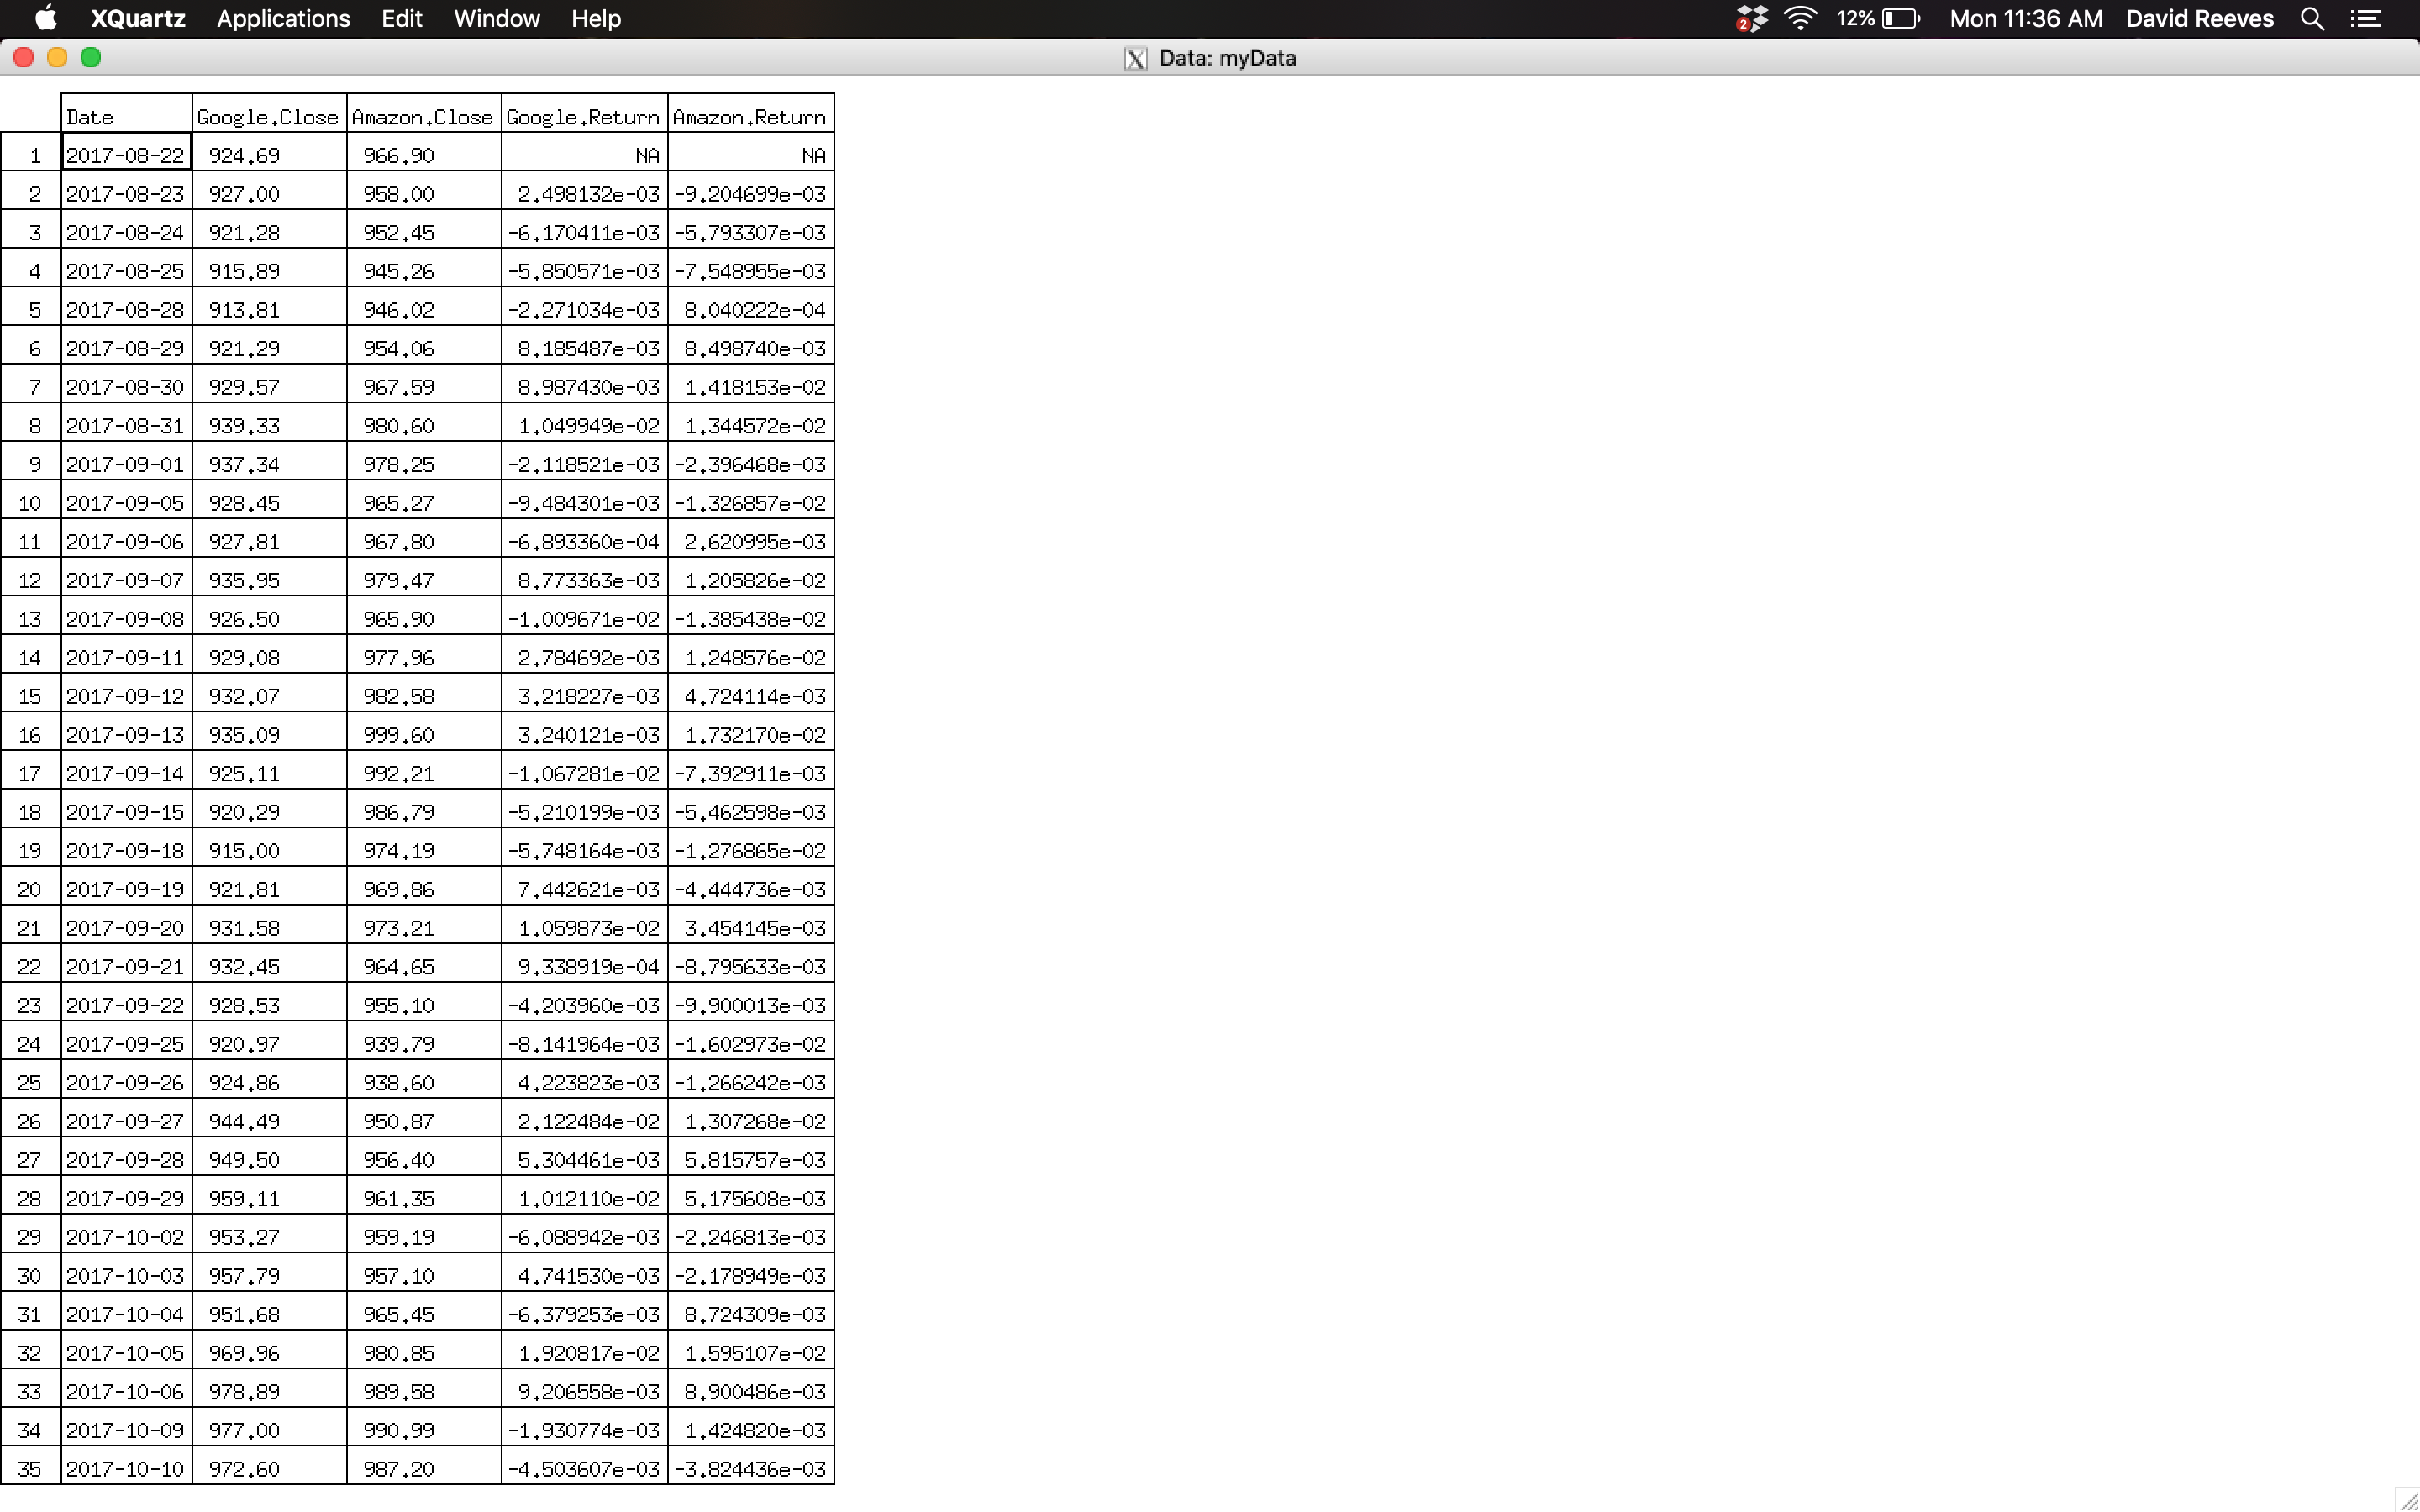
Can you please post an example of your data? Running the dput() function on an object that holds data and pasting the output here provides a convenient way for others to use your data. For example, if you have a data frame named DF, you can post its entire content using the output of
dput(DF)
If you want to post only part of the data frame, you can use the head() function to select the first N rows
Let's back up a step. How do you get your data. Please show the actual code you use to read in or otherwise create your data. Put a line with three back ticks just before and after your code.
```
Your code here
```