Dear I have some problem when plotting segments (representing edges of a grah) with geom_segment (package ggplot2).
Here is the code:
#fake data creation fro testing
# patients data frame
idStr = matrix(1:npz, nrow=npz, ncol=1)
idStr = as.character(idStr)
age <- as.numeric(matrix(floor(runif(npz,min=0,max=101)), nrow=npz, ncol=1))
stage <- as.numeric(matrix(floor(runif(npz,min=1,max=5)), nrow=npz, ncol=1))
relevantFeat <-as.numeric(matrix(runif(npz), nrow=npz, ncol=1))
patients <- data.frame(id=idStr, feat1= age, feat2= stage, feat3 = relevantFeat)
#end patient data frame
#fake classification scores for each patient andlabel generation
scores<-data.frame(id=idStr, score=matrix(runif(npz), nrow=npz, ncol=1))
ind.pos <- which(scores$score > 0.5) #genero dei positivi a caso
labels <- matrix(0, nrow = npz, ncol=1)
labels[ind.pos,]<-1
threshSim <- 0.5
#fake adjacency matrix
similarity <- cor(t(patients[,2:ncol(patients)]), method = "pearson")
diag(similarity)<- 0 #così quella similarità non viene contata!
indSimilar <- which(similarity>threshSim);
indSimilar <- arrayInd(indSimilar, dim(similarity))
#creation of a data frame containing edges connecting patients (idx1 = index in patients of one vertex, idx2 = index of patient at the end of the vertex)
similarTo <- data.frame(idx1=indSimilar[,1], idx2= indSimilar[,2])
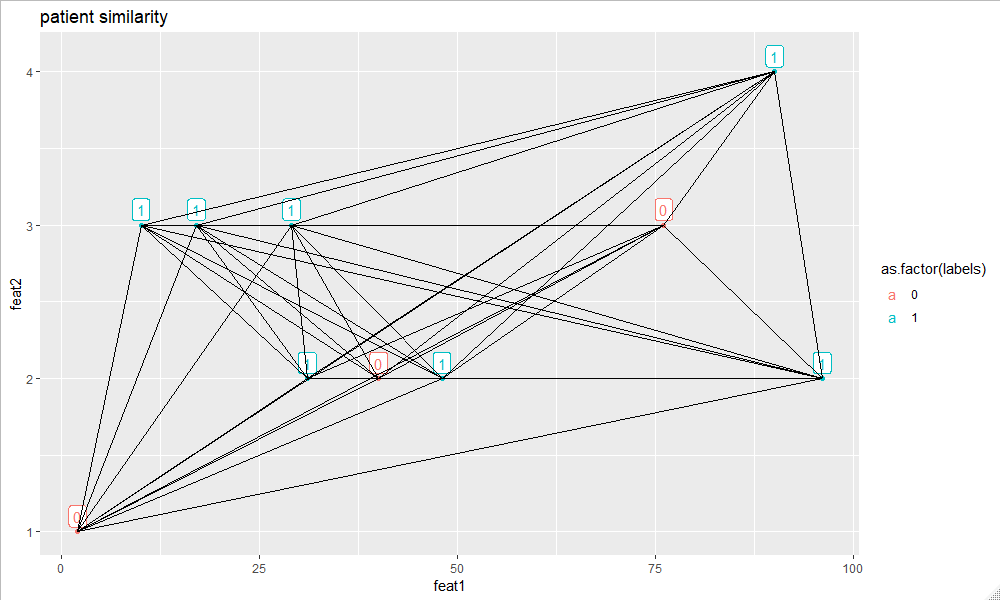
#now I plot the data : THIS WORKS
p2<- ggplot(patients, aes(feat1, feat2, color = labels) )+ geom_point()+
xlab("feat1") + ylab("feat2") + ggtitle("patient similarity")
# Adding edges
for (i in 1: nrow(similarTo)){
# create data frame for x, xend, y yend
df<- data.frame(x1 = as.numeric(patients[similarTo[i,"idx1"],]$feat1),
y1 = as.numeric(patients[similarTo[i,"idx1"],]$feat2),
x2 = as.numeric(patients[similarTo[i,"idx2"],]$feat1),
y2 = as.numeric(patients[similarTo[i,"idx2"],]$feat2))
p2<-p2+geom_segment(aes(x = as.numeric(x1), y = as.numeric(y1),
xend = as.numeric(x2), yend = as.numeric(y2), color='segment'), data = df)
}
WHEN I RUN THE LAST FOR LOOP R says:
"Error: Discrete value supplied to continuous scale"
WHY??? all the data are numeric!