Hello everybody,
This is a separate question regarding my data. I utilised the formula which mister andresrcs suggested and it worked wonders with the box plots. However, due to my lack of experience I fail yet again.
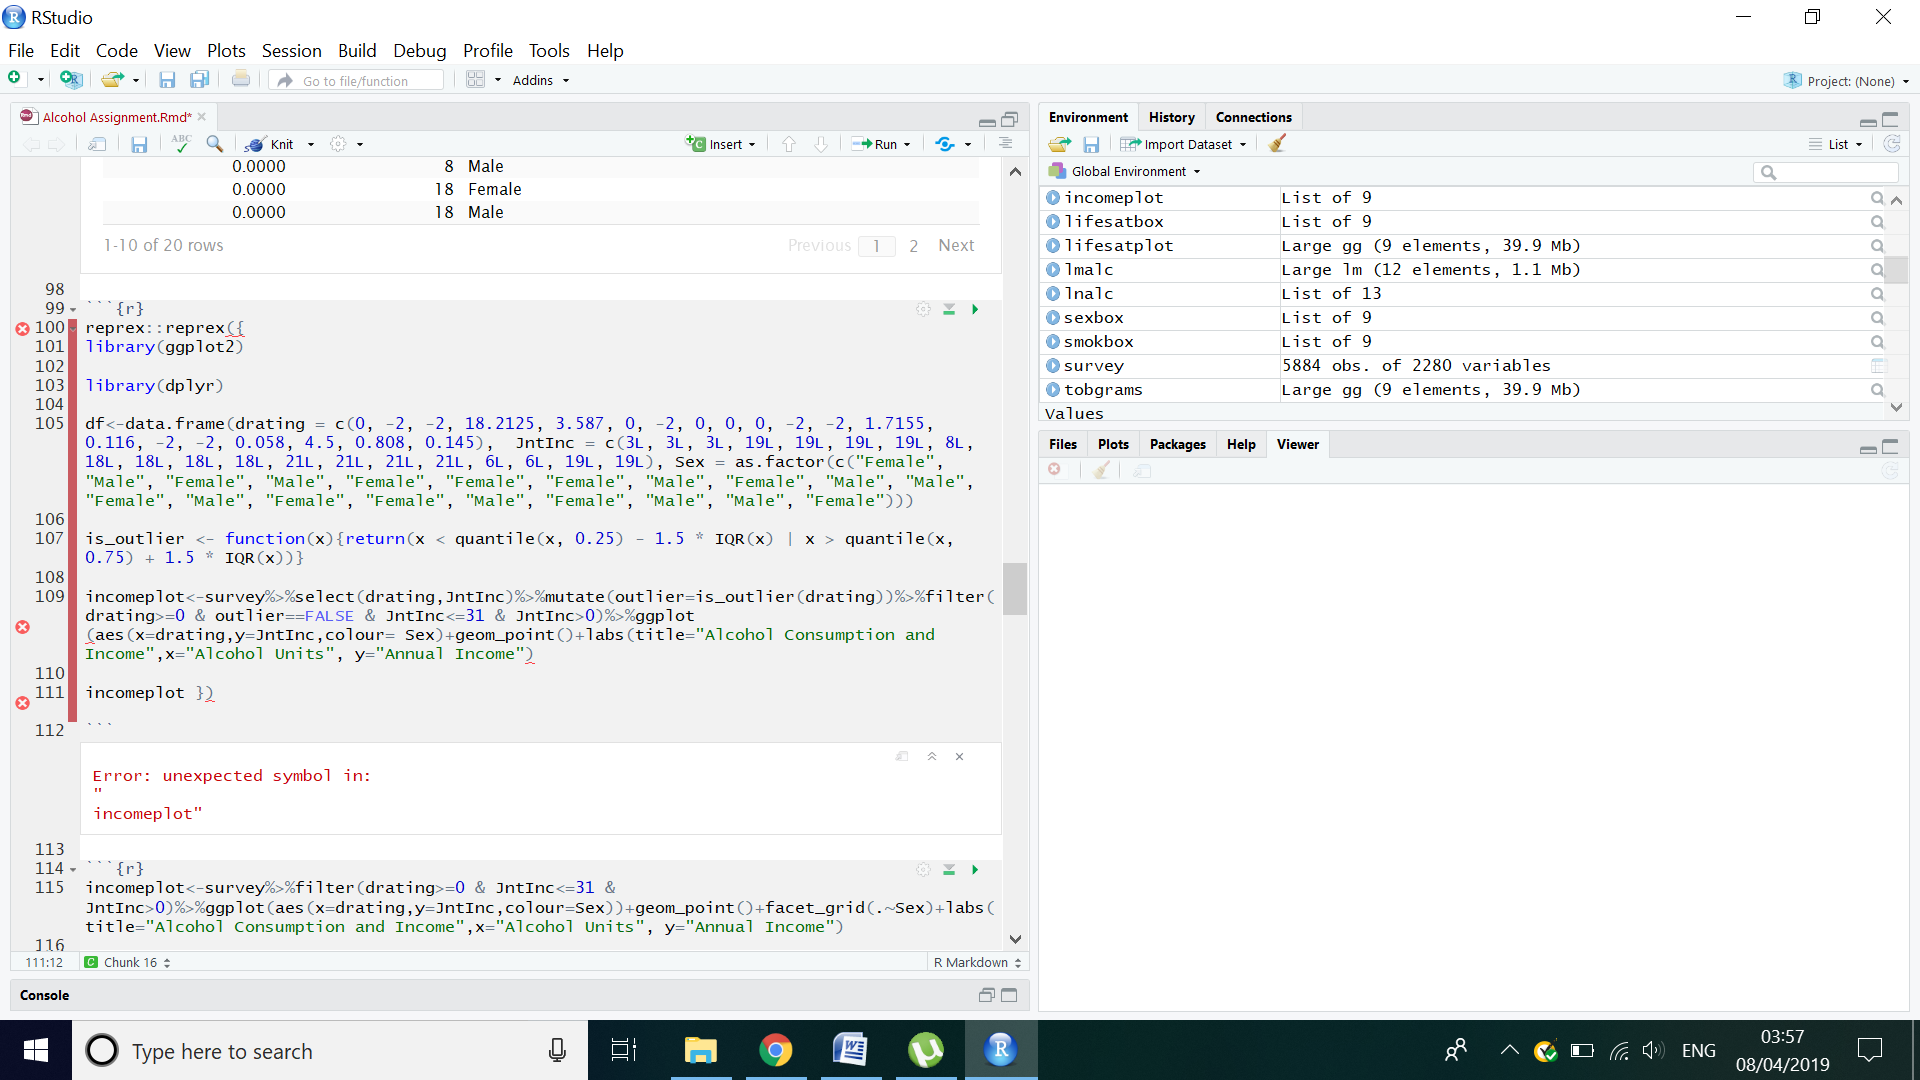
I attempted to do a scatter plot, based on Alcohol Units per Week and Individual/Couple Annual Income. I tried to colour the points based on the variable 'Sex', however the console states that the object 'Sex' was not found.
Again I apologise for asking a rather trivial question and I thank you in advance for all your help.
library(ggplot2)
library(dplyr)

df<-data.frame(drating = c(0, -2, -2, 18.2125, 3.587, 0, -2, 0, 0, 0, -2, -2, 1.7155, 0.116, -2,  -2, 0.058, 4.5, 0.808, 0.145), JntInc = c(3L, 3L, 3L, 19L, 19L, 19L, 19L, 8L, 18L, 18L, 18L, 18L, 21L, 21L, 21L, 21L, 6L, 6L, 19L, 19L))

is_outlier <- function(x){return(x < quantile(x, 0.25) - 1.5 * IQR(x) | x > quantile(x, 0.75) + 1.5 * IQR(x))}

incomeplot<-survey%>%select(drating, JntInc)%>%mutate(outlier=is_outlier(drating))%>%filter(drating>=0 & outlier==FALSE & JntInc<=31 & JntInc>0)%>%ggplot(aes(x=drating,y=JntInc,colour=Sex))+geom_point()+labs(title="Alcohol Consumption and Income",x="Alcohol Units", y="Annual Income")

incomeplot