I have a set of functions that make different plots using a data file from our FACS. Then I want to call all these functions in another function.
So I have 7 functions that does different things with the data and one function that calls these functions and creates a pdf with all plots. When I first run the script containing all of this I can see all the functions in the environment window in RStudio.
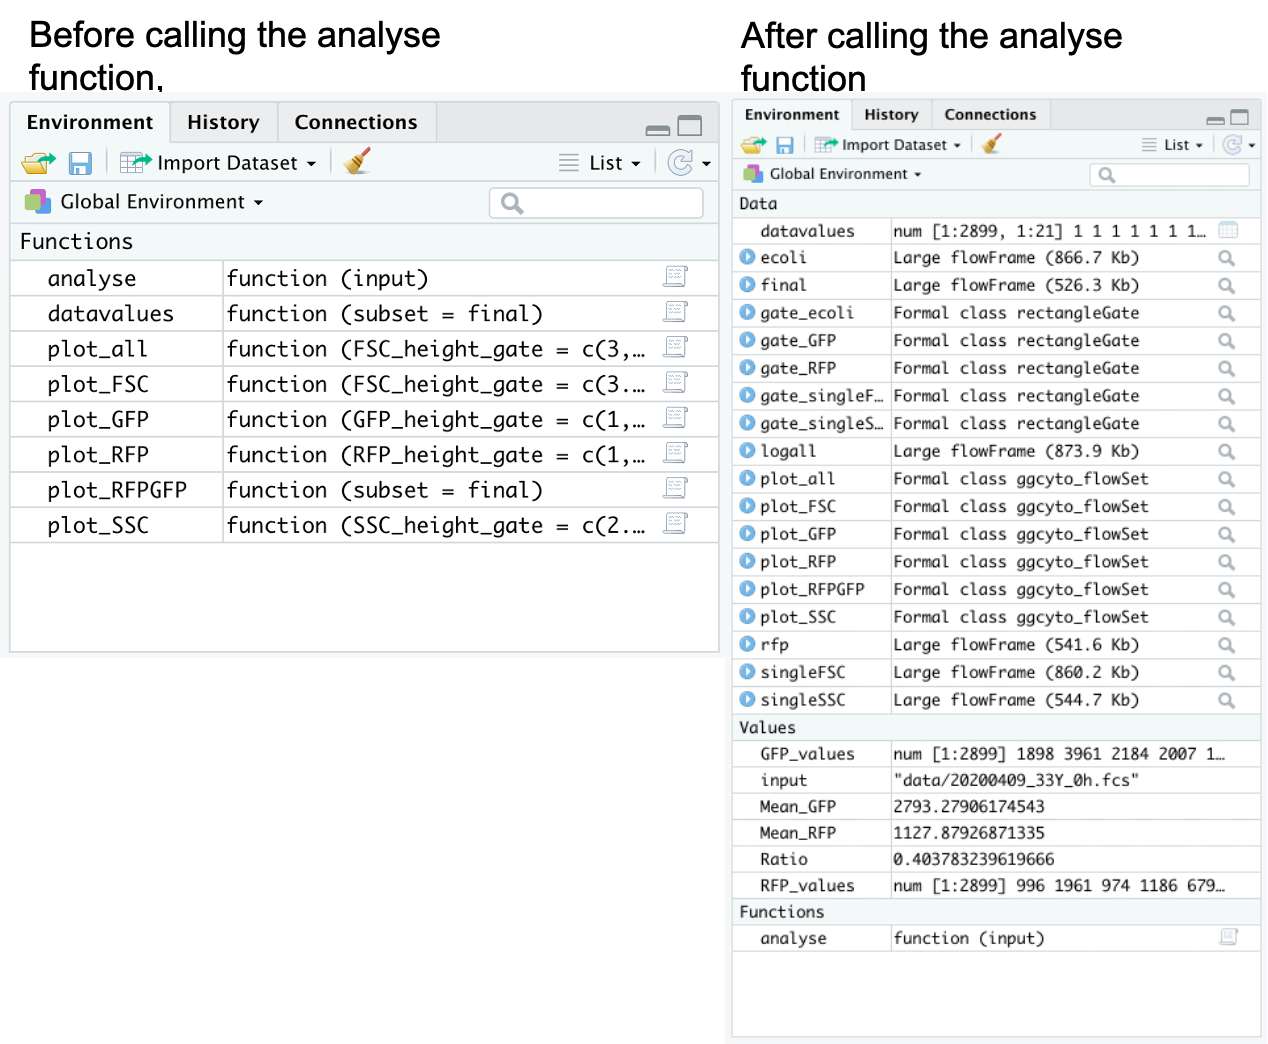
Then I call the functions that calls the other functions (analyse()). It seems to work fine and I get the predicted outputs.
But after the analyse function is called and has run, the other functions seem to disappear from the environment window and they cant be called.
#Writes a function that will establish a gating hierachy, create plots as well as extract fluorescence intensity
#and calculate RFP/GFP ratio
#The gates might have to be adjusted when analysing a new dataset
#FL1 is the channel for green fluorescence
#FL3 is the channel for red fluorescence

#import libraries
library("BiocManager")
library("BiocVersion")
library("flowCore")
library("openCyto")
library("flowViz")
library("flowWorkspace")
library("ncdfFlow")
library(ggplot2)
library(ggcyto)

plot_all <- function(FSC_height_gate=c(3,4), SSC_height_gate=c(2.5,4), subset=logall){
        #Create gate and set limits
        gate_ecoli <<-rectangleGate("FSC.HEIGHT"=FSC_height_gate, "SSC.HEIGHT"=SSC_height_gate)
        #plot all events in a FSC vs SSC height plot and gate
        plot_all <<-ggcyto(logall, aes(x="FSC.HEIGHT", y="SSC.HEIGHT"))  + geom_hex(bins=128) + coord_cartesian(xlim=c(0, 6)) + xlab("FSC Height") + ylab("SSC Height") + geom_gate(gate_ecoli)
        #Define subpopulation containing only E. coli events
        ecoli <<- Subset(logall, gate_ecoli)
        plot_all
}

plot_FSC <- function(FSC_height_gate=c(3.2,4.8), FSC_width_gate=c(5.1,5.3), subset=ecoli){
        #Create gate and set limits
        gate_singleFSC <<-rectangleGate("FSC.HEIGHT"=FSC_height_gate, "FSC.WIDTH"=FSC_width_gate)
        #plot all events in a FSC height vs FSC width plot and gate
        plot_FSC <<-ggcyto(subset, aes(x="FSC.HEIGHT", y="FSC.WIDTH"))  + geom_hex(bins=128) + coord_cartesian(xlim = c(0, 6), ylim = c(4,7)) + xlab("FSC Height") + ylab("FSC Width") + geom_gate(gate_singleFSC)
        #Define FSC single subset
        singleFSC <<- Subset(ecoli,gate_singleFSC)
        plot_FSC
}

plot_SSC <- function(SSC_height_gate=c(2.5,4), SSC_width_gate=c(5.1,5.3), subset=singleFSC){
        #Create gate and set limits
        gate_singleSSC <<-rectangleGate("SSC.HEIGHT"=SSC_height_gate, "SSC.WIDTH"=SSC_width_gate)
        #plot all events in a FSC vs SSC height plot and gate
        plot_SSC <<- ggcyto(subset, aes(x="SSC.HEIGHT", y="SSC.WIDTH"))  + geom_hex(bins=128) + coord_cartesian(xlim=c(2, 5), ylim = c(4,7)) + xlab("SSC Height") + ylab("SSC Width") + geom_gate(gate_singleSSC)
        #Define  single subset
        singleSSC <<- Subset(singleFSC ,gate_singleSSC)
        plot_SSC
}

plot_RFP <- function(RFP_height_gate=c(1,6), subset=singleSSC){
        #Create gate and set limits
        gate_RFP <<- rectangleGate("FL3.HEIGHT"=RFP_height_gate)
        #plot all events in a FSC vs SSC height plot and gate
        plot_RFP <<- autoplot(subset, "FL3.HEIGHT") + coord_cartesian(xlim=c(0, 6)) + xlab("Red fluorescence") + ylab("Density") + geom_gate(gate_RFP)
        #Define  single subset
        rfp <<- Subset(singleSSC,gate_RFP)
        plot_RFP
}

plot_GFP <- function(GFP_height_gate=c(1,6), subset=rfp){
        #Create gate and set limits
        gate_GFP <<- rectangleGate("FL1.HEIGHT"=GFP_height_gate)
        #plot all events in a FSC vs SSC height plot and gate
        plot_GFP <<- autoplot(subset, "FL1.HEIGHT") + coord_cartesian(xlim=c(0, 6)) + xlab("Green fluorescence") + ylab("Density") + geom_gate(gate_GFP)
        #Define  single subset
        final <<- Subset(rfp,gate_GFP)
        plot_GFP
}

plot_RFPGFP <- function(subset=final){
        #plot all events in a FSC vs SSC height plot and gate
        plot_RFPGFP <<- ggcyto(subset, aes(x="FL3.HEIGHT", y="FL1.HEIGHT"))  + geom_hex(bins=128) + coord_cartesian(xlim=c(0, 6), ylim = c(0,6)) + xlab("Red fluorescence") + ylab("Green fluorescence")
        #Define  single subset
        plot_RFPGFP
}

datavalues <- function(subset=final){
        #extract data from the final dataset
        datavalues <<- 10^(exprs(subset))

        #extract rfp values
        RFP_values <<- na.omit(datavalues[,15])

        #calculate mean of rfp
        Mean_RFP <<- mean(RFP_values)

        #extract gfp values
        GFP_values <<- na.omit(datavalues[,9])

        #calculate mean of gfp
        Mean_GFP <<- mean(GFP_values)

        #calculate the ratio between rfp and gfp
        Ratio <<- Mean_RFP/Mean_GFP
        Ratio
}

analyse <- function(input) {
        #create a pefix to use in output files to identify which dataset the output is generated fom
        prefix <- substr(input,6,nchar(input)-4)
        #read in dataset and omit any missing values
        Allevents <- na.omit(read.FCS(input, alter.names = TRUE))
        #logtransform the FSC.HEIGHT, FSC.WIDTH, SSC.HEIGHT, SSC.WIDTH, FL1.HEIGHT and FL3.HEIGHT columns
        logall <<- transform(Allevents, transformList(c("FSC.HEIGHT", "SSC.HEIGHT", "FSC.WIDTH", "SSC.WIDTH", "FL3.HEIGHT", "FL1.HEIGHT"),log10))

        #Create gate and plot events in FSC height vs SSC height plot and gate. Default subset used is logall, this can be changed by giving the argument (3rd argument) subset=...
        #Also create the subset ecoli with events in gate. If the gate needs to be adjusted: (c(x1,x2), c(y1,y2)) as the argument to the function
        plot_all()

        #Create gate and plot events in FSC height vs FSC width plot and gate. Default subset used is ecoli, this can be changed by giving the argument (3rd argument) subset=...
        #Also create the subset singelFSC with events in gate. If the gate needs to be adjusted: (c(x1,x2), c(y1,y2)) as the argument to the function
        plot_FSC()


        #Create gate and plot events in SSC height vs SSC width plot and gate. Default subset used is singleFSC, this can be changed by giving the argument (3rd argument) subset=...
        #Also create the subset singelSSC with events in gate. If the gate needs to be adjusted: (c(x1,x2), c(y1,y2)) as the argument to the function
        plot_SSC()

        #Create gate and plot events in RFP height plot and gate. Default subset used is singleSSC, this can be changed by giving the argument (2nd argument) subset=...
        #Also create the subset rfp with events in gate. If the gate needs to be adjusted: (c(x,y)) as the argument to the function
        plot_RFP()

        #Create gate and plot events in GFP height plot and gate. Default subset used is rfp, this can be changed by giving the argument (2nd argument) subset=...
        #Also create the subset final with events in gate. If the gate needs to be adjusted: (c(x,y)) as the argument to the function.
        plot_GFP()

        #Plot events in RFP height vs GFP height plot. Default subset used is final, this can be changed by giving the argument (1st argument) subset=...
        #Also create the subset singelSSC with events in gate. If the gate needs to be adjusted: (c(x1,x2), c(y1,y2)) as the argument to the function
        plot_RFPGFP()

        #Extracts the data from the final subset. This can be changed by giving the argument (1st argument) subset=...
        #Then extracts RFP_values, GFP_values and calculates Mean_RFP, Mean_GFP, Ratio
        datavalues()

        header<-substr(input,15,nchar(input)-7)

        #create vector of values
        v<-c(header, Mean_RFP, Mean_GFP, Ratio)

        #create a pdf file with all plots
        pdf(paste0("output_plots/",prefix,".pdf"))
        plot(plot_all)
        plot(plot_FSC)
        plot(plot_SSC)
        plot(plot_RFP)
        plot(plot_GFP)
        plot(plot_RFPGFP)
        dev.off()

        #create single images of the RFP vs GFP plot to use in rmarkdown
        #png(filename = paste0("output_plots/plot_final_",prefix,".png"), width = 170, height = 170)
        #plot(plot_RFPGFP)
        #dev.off()

        #write a csv file containg the mean RFP and GFP and the RFP/GFP ratio
        write(v, file=(paste0("output_tables/",prefix,".csv")))
}