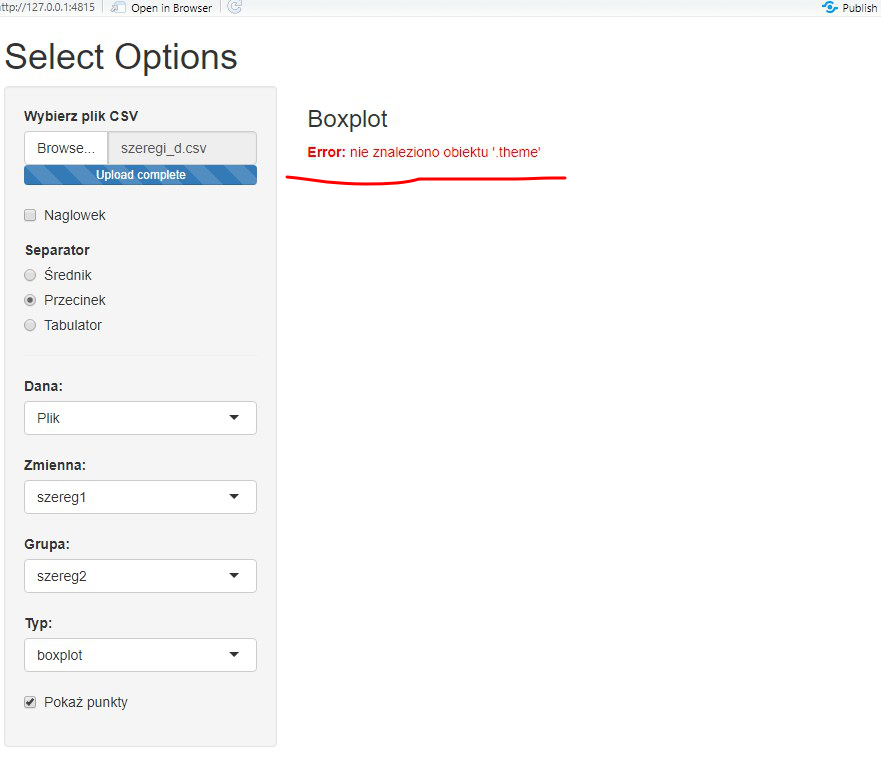
Hi, my application won't work, unfortunately I can't find a reason. Someone will help?
#########file server.R
# shiny server side code for each call
server<-(function(input, output, session){

  #update group and
  #variables based on the data
  observe({
    #browser()
    if(!exists(input$dataset)) return() #make sure upload exists
    var.opts<-colnames(get(input$dataset))
    updateSelectInput(session, "variable", choices = var.opts)
    updateSelectInput(session, "group", choices = var.opts)
  })

  output$caption<-renderText({
    switch(input$plot.type,
           "boxplot" 	= 	"Boxplot",
           "histogram" =	"Histogram")
  })


  output$plot <- renderUI({
    plotOutput("p")
  })

  #get data object
  get_data<-reactive({

    if(!exists(input$dataset)) return() # if no upload

    check<-function(x){is.null(x) || x==""}
    if(check(input$dataset)) return()

    obj<-list(data=get(input$dataset),
              variable=input$variable,
              group=input$group
    )

    #require all to be set to proceed
    if(any(sapply(obj,check))) return()
    #make sure choices had a chance to update
    check<-function(obj){
      !all(c(obj$variable,obj$group) %in% colnames(obj$data))
    }

    if(check(obj)) return()


    obj

  })

  #plotting function using ggplot2
  output$p <- renderPlot({

    plot.obj<-get_data()

    #conditions for plotting
    if(is.null(plot.obj)) return()

    #make sure variable and group have loaded
    if(plot.obj$variable == "" | plot.obj$group =="") return()

    #plot types
    plot.type<-switch(input$plot.type,
                      "boxplot" 	= geom_boxplot(),
                      "histogram" =	geom_histogram(alpha=0.5,position="identity"),
                      "density" 	=	geom_density(alpha=.75),
                      "bar" 		=	geom_bar(position="dodge")
    )


    if(input$plot.type=="boxplot")	{		#control for 1D or 2D graphs
      p<-ggplot(plot.obj$data,
                aes_string(
                  x 		= plot.obj$group,
                  y 		= plot.obj$variable,
                  fill 	= plot.obj$group # let type determine plotting
                )
      ) + plot.type

      if(input$show.points==TRUE)
      {
        p<-p+ geom_point(color='black',alpha=0.5, position = 'jitter')
      }

    } else {

      p<-ggplot(plot.obj$data,
                aes_string(
                  x 		= plot.obj$variable,
                  fill 	= plot.obj$group,
                  group 	= plot.obj$group
                  #color 	= as.factor(plot.obj$group)
                )
      ) + plot.type
    }

    p<-p+labs(
      fill 	= input$group,
      x 		= "",
      y 		= input$variable
    )  +
      .theme
    print(p)
  })

  # set uploaded file
  upload_data<-reactive({

    inFile <- input$file1

    if (is.null(inFile))
      return(NULL)

    #could also store in a reactiveValues
    read.csv(inFile$datapath,
             header = input$header,
             sep = input$sep)
  })

  observeEvent(input$file1,{
    inFile<<-upload_data()
  })


})


# Create Shiny app ----
shinyApp(ui, server)
########### File UI.R
#initialize
library(shiny)
library(ggplot2)
library(purrr)
library(dplyr)

#plotting theme for ggplot2
.theme<- theme(
  axis.line = element_line(colour = 'gray', size = .75),
  panel.background = element_blank(),
  plot.background = element_blank()
)


# UI for app
ui<-(pageWithSidebar(
  # title
  headerPanel("Select Options"),

  #input
  sidebarPanel
  (
    # Input: Select a file ----

    fileInput("file1", "Wybierz plik CSV",
              accept = c("text/csv",
                         "text/comma-separated-values,text/plain",
                         ".csv")),
    # Input: Checkbox if file has header ----
    checkboxInput("header", "Naglowek", TRUE),

    # Input: Select separator ----
    radioButtons("sep", "Separator",
                 choices = c(Średnik = ";",
                             Przecinek = ",",
                             Tabulator = "\t"),
                 selected = ";"),
    # Horizontal line ----
    tags$hr(),


    # Input: Select what to display
    selectInput("dataset","Dana:",
                choices =list(Plik = "inFile", iris = "iris"), selected=NULL),
    selectInput("variable","Zmienna:", choices = NULL),
    selectInput("group","Grupa:", choices = NULL),
    selectInput("plot.type","Typ:",
                list(boxplot = "boxplot", histogram = "histogram")
    ),
    checkboxInput("show.points", "Pokaż punkty", TRUE)
  ),

  # output
  mainPanel(
    h3(textOutput("caption")),
    #h3(htmlOutput("caption")),
    uiOutput("plot") # depends on input
  )
))
ERROR
> runApp()

Listening on http://127.0.0.1:3819
Ostrzeżenie: Error in force: nie znaleziono obiektu 'ui'
  54: force
  53: uiHttpHandler
  52: shinyApp
Error in force(ui) : nie znaleziono obiektu 'ui'
Thanks for any Help