hi guys,
so this is my code:
ggplot(data, aes(x = Corporations, y = Q1.19, fill = Instruments)) +
  geom_bar(position = "fill", stat = "identity") +
  coord_polar() +
  ggtitle(expression(paste(underline("Quartal 1, 2019")))) +
  theme(panel.background = element_rect(colour = "grey"),
        panel.border = element_blank(),
        panel.grid.major = element_blank(),
        panel.grid.minor = element_blank(),
        legend.background = element_rect(colour = "grey"),
        axis.title.x = element_blank(),
        axis.title.y = element_blank(),
        axis.text.y=element_blank(),
        axis.ticks.x = element_blank(),
        axis.ticks.y = element_blank(),
        plot.title = element_text(hjust = 0.5, size = 20)) +
  scale_x_discrete(labels = wrap_format(10)) +
  geom_text(aes(y=`sum(Q1.19)`, label = paste(format(`sum(Q1.19)`, big.mark = ".", scientific = FALSE), "Mio. €"),),
            size = 4, position = position_fill(vjust = 0.7))
but actually I´m not that good in R...so can anybody help me to change the colors ?
those colors don´t look good to me, thats why I want to change them
You can specify the colors you want to use for your discrete scale using scale_fill_manual()
If you need more specific help, please provide a proper REPRoducible EXample (reprex) illustrating your issue.
xxxxdf
3
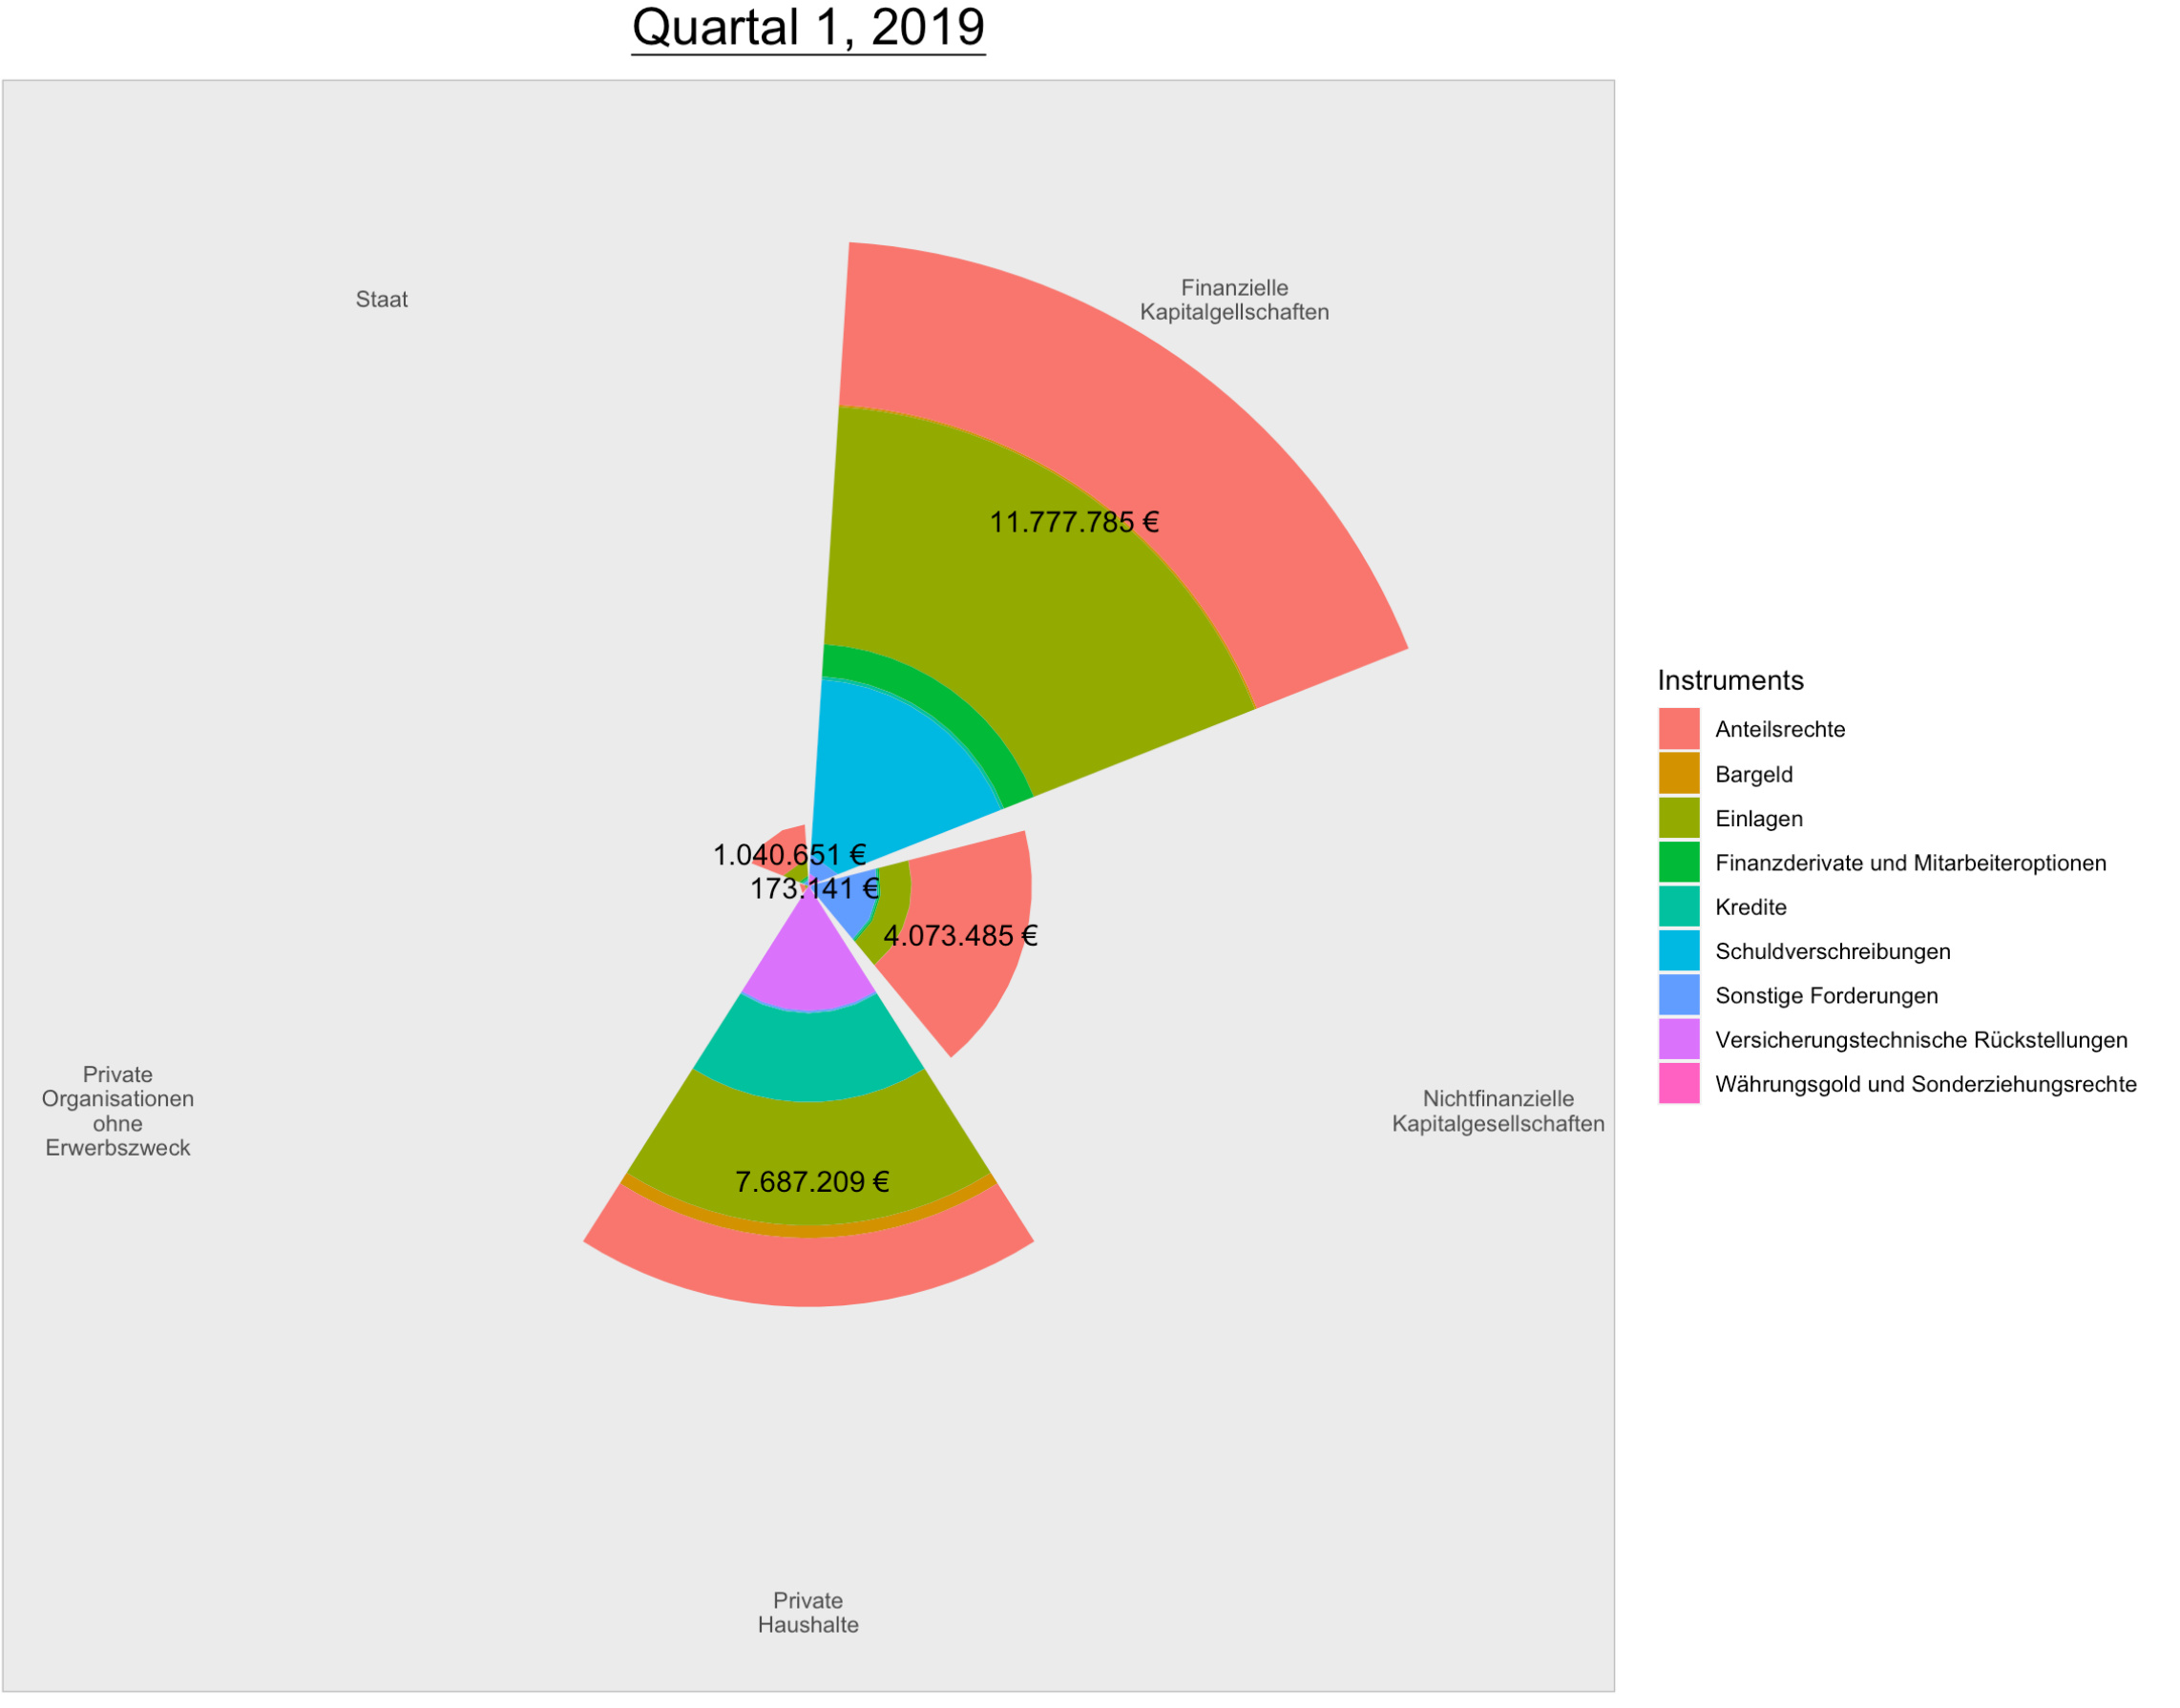
ggplot(data, aes(x = Corporations, y = Q1.19, fill = Instruments)) +
geom_bar(position = "stack", stat = "identity") +
coord_polar() +
ggtitle(expression(paste(underline("Quartal 1, 2019")))) +
theme(panel.background = element_rect(colour = "grey"),
panel.border = element_blank(),
panel.grid.major = element_blank(),
panel.grid.minor = element_blank(),
axis.title.x = element_blank(),
axis.title.y = element_blank(),
axis.text.y=element_blank(),
axis.ticks.x = element_blank(),
axis.ticks.y = element_blank(),
plot.title = element_text(hjust = 0.5, size = 20)) +
scale_x_discrete(labels = wrap_format(10)) +
geom_text(aes(y=sum(Q1.19), label = paste(format(sum(Q1.19), big.mark = ".", scientific = FALSE), "€"),),
size = 4, position = position_stack(vjust = 0.7))
Hey Guys,
this is the code I use. I´m not that fit with R so can anybody explain how to change colors in here.
That is the graphic and I want to change all those colors.
you could define colours manually, or use an existing diverging palette,
for example
+ scale_fill_discrete_divergingx(palette="Temps")
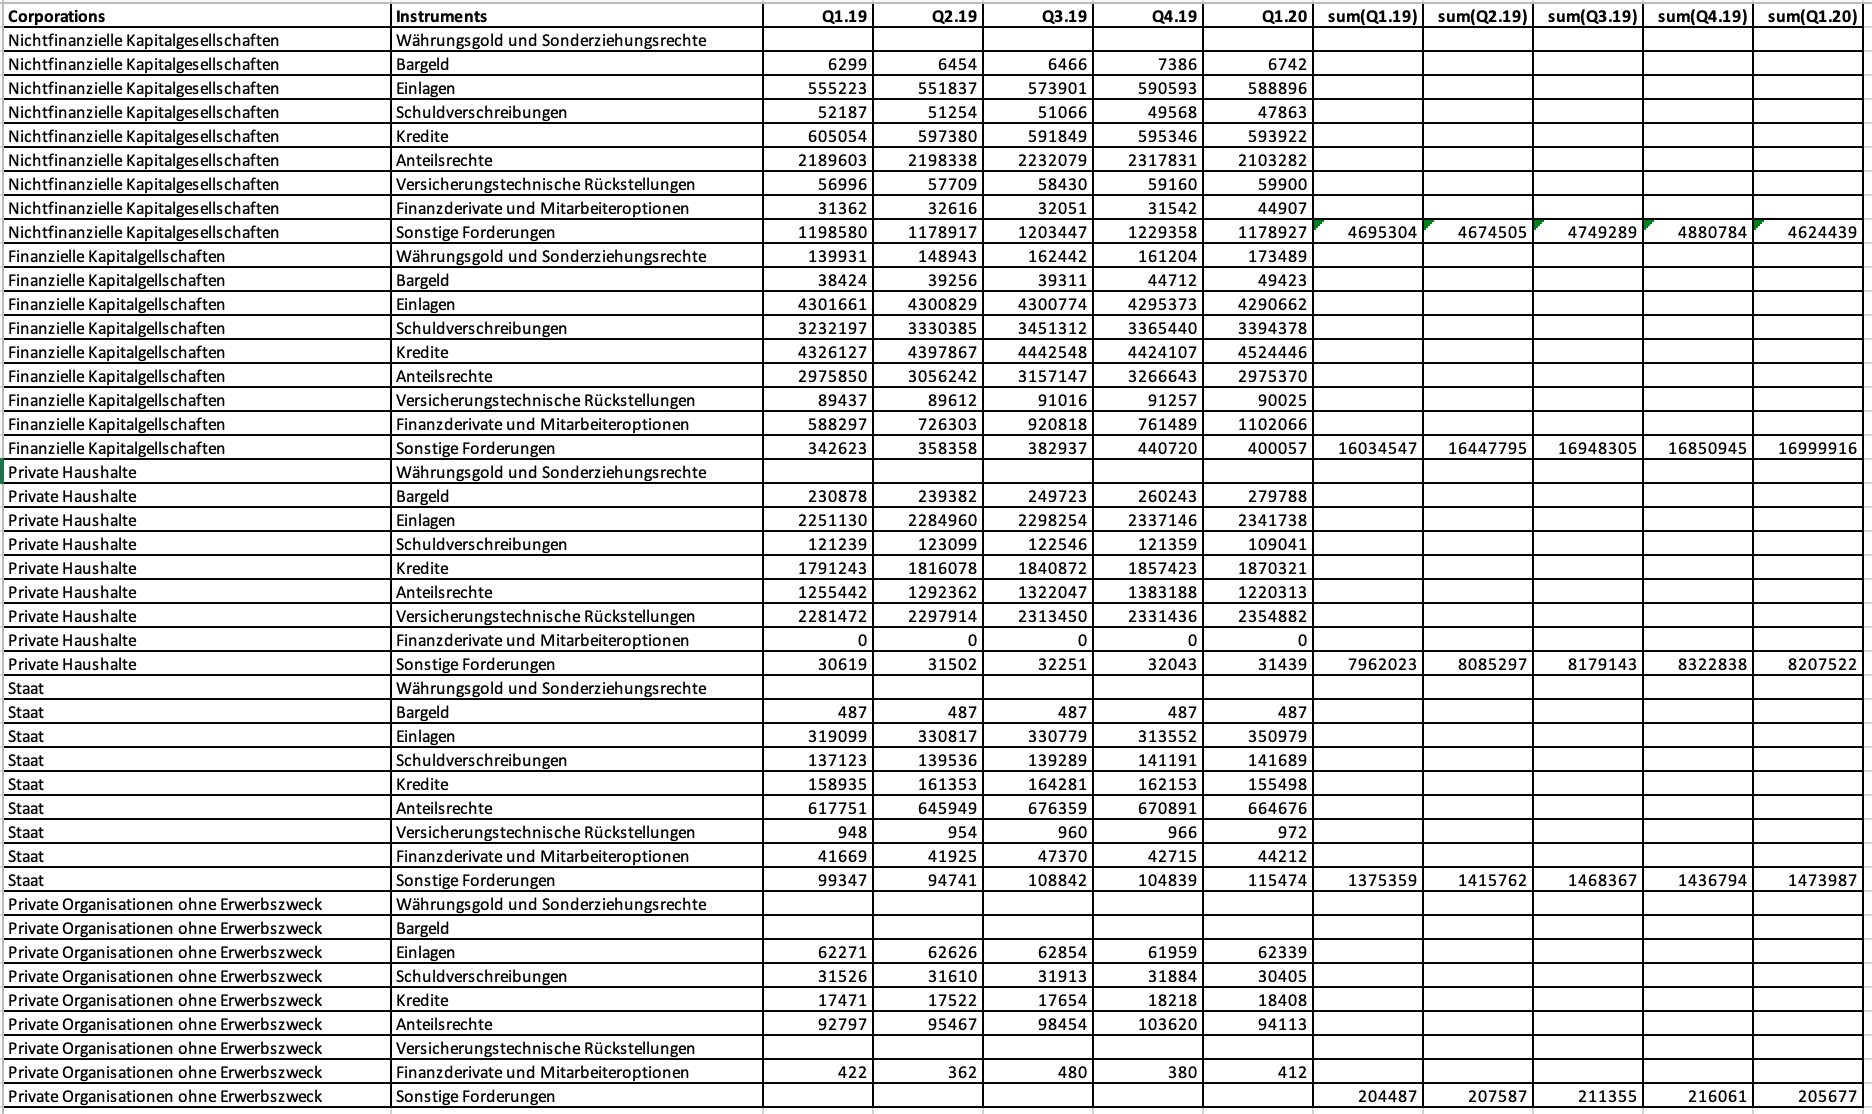
This is a screenshot of my data.
I don't know how to define the colors for the instruments.
I tried it with my own discrete scale, but it doesn't work
We can't copy/paste from a screenshot, as I said, if you need more specific help, please provide a reprex as explained in the link I gave you.
#> Corporations	                                Instruments	                                             Q1.19
Nichtfinanzielle Kapitalgesellschaften	Währungsgold und Sonderziehungsrechte
Nichtfinanzielle Kapitalgesellschaften	Bargeld	                                                     6299
Nichtfinanzielle Kapitalgesellschaften	Einlagen	                                                     555223
Nichtfinanzielle Kapitalgesellschaften	Schuldverschreibungen	                             52187
Nichtfinanzielle Kapitalgesellschaften	Kredite	                                                     605054
Nichtfinanzielle Kapitalgesellschaften	Anteilsrechte	                                             2189603
Nichtfinanzielle Kapitalgesellschaften	Versicherungstechnische Rückstellungen   56996
Nichtfinanzielle Kapitalgesellschaften	Finanzderivate und Mitarbeiteroptionen	     31362
Nichtfinanzielle Kapitalgesellschaften	Sonstige Forderungen	                             1198580
Finanzielle Kapitalgellschaften	Währungsgold und Sonderziehungsrechte	139931
Finanzielle Kapitalgellschaften	Bargeld	38424
Finanzielle Kapitalgellschaften	Einlagen	4301661
Finanzielle Kapitalgellschaften	Schuldverschreibungen	3232197
Finanzielle Kapitalgellschaften	Kredite	4326127
Finanzielle Kapitalgellschaften	Anteilsrechte	2975850
Finanzielle Kapitalgellschaften	Versicherungstechnische Rückstellungen	89437
Finanzielle Kapitalgellschaften	Finanzderivate und Mitarbeiteroptionen	588297
Finanzielle Kapitalgellschaften	Sonstige Forderungen	342623
Private Haushalte	Währungsgold und Sonderziehungsrechte
Private Haushalte	Bargeld	230878
Private Haushalte	Einlagen	2251130
Private Haushalte	Schuldverschreibungen	121239
Private Haushalte	Kredite	1791243
Private Haushalte	Anteilsrechte	1255442
Private Haushalte	Versicherungstechnische Rückstellungen	2281472
Private Haushalte	Finanzderivate und Mitarbeiteroptionen	0
Private Haushalte	Sonstige Forderungen	30619
Staat	Währungsgold und Sonderziehungsrechte
Staat	Bargeld	487
Staat	Einlagen	319099
Staat	Schuldverschreibungen	137123
Staat	Kredite	158935
Staat	Anteilsrechte	617751
Staat	Versicherungstechnische Rückstellungen	948
Staat	Finanzderivate und Mitarbeiteroptionen	41669
Staat	Sonstige Forderungen	99347
Private Organisationen ohne Erwerbszweck	Währungsgold und Sonderziehungsrechte
Private Organisationen ohne Erwerbszweck	Bargeld
Private Organisationen ohne Erwerbszweck	Einlagen	62271
Private Organisationen ohne Erwerbszweck	Schuldverschreibungen	31526
Private Organisationen ohne Erwerbszweck	Kredite	17471
Private Organisationen ohne Erwerbszweck	Anteilsrechte	92797
Private Organisationen ohne Erwerbszweck	Versicherungstechnische Rückstellungen
Private Organisationen ohne Erwerbszweck	Finanzderivate und Mitarbeiteroptionen	422
Private Organisationen ohne Erwerbszweck	Sonstige Forderungen
in the bellow change "a", "b" "c" etc, to the names of your instruments, and relate them to what colour you want. Then use scale_fill_manual as shown.
list_of_colours_per_instrument <- list(
  "a"="blue",
  "b"="black",
  "c"="red",
  "d"="pink",
  "e"="yellow",
  "f"="red",
  "g"="green",
  "h"="brown",
  "i"="purple"
)

ggplot(data, aes(x = Corporations, y = Q1.19, fill = Instruments)) +
  geom_bar(position = "fill", stat = "identity") +
  coord_polar() +
  ggtitle(expression(paste(underline("Quartal 1, 2019")))) +
  theme(panel.background = element_rect(colour = "grey"),
        panel.border = element_blank(),
        panel.grid.major = element_blank(),
        panel.grid.minor = element_blank(),
        legend.background = element_rect(colour = "grey"),
        axis.title.x = element_blank(),
        axis.title.y = element_blank(),
        axis.text.y=element_blank(),
        axis.ticks.x = element_blank(),
        axis.ticks.y = element_blank(),
        plot.title = element_text(hjust = 0.5, size = 20)) +
  scale_x_discrete(labels = wrap_format(10)) +
  geom_text(aes(y=sum(Q1.19), label = paste(format(sum(Q1.19), big.mark = ".", scientific = FALSE), "Mio. €"),),
            size = 4, position = position_fill(vjust = 0.7)) +
  scale_fill_manual(values = list_of_colours_per_instrument)
system
Closed
9
This topic was automatically closed 21 days after the last reply. New replies are no longer allowed.