Hi there mates! I´m currently working with a coronavirus dataset and I have some problems with the geom_point function. (The dataframe I am showint you you is a simplification of what i am currently working):
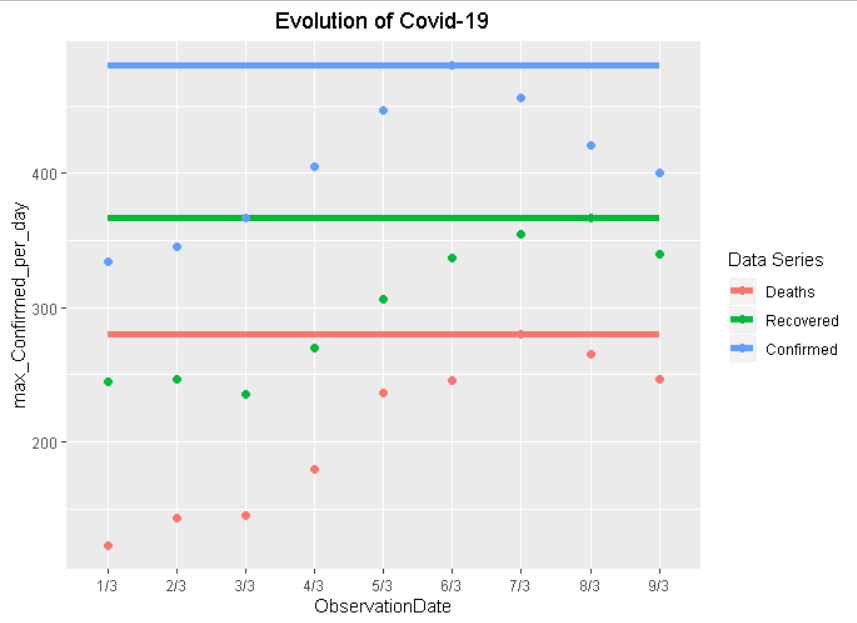
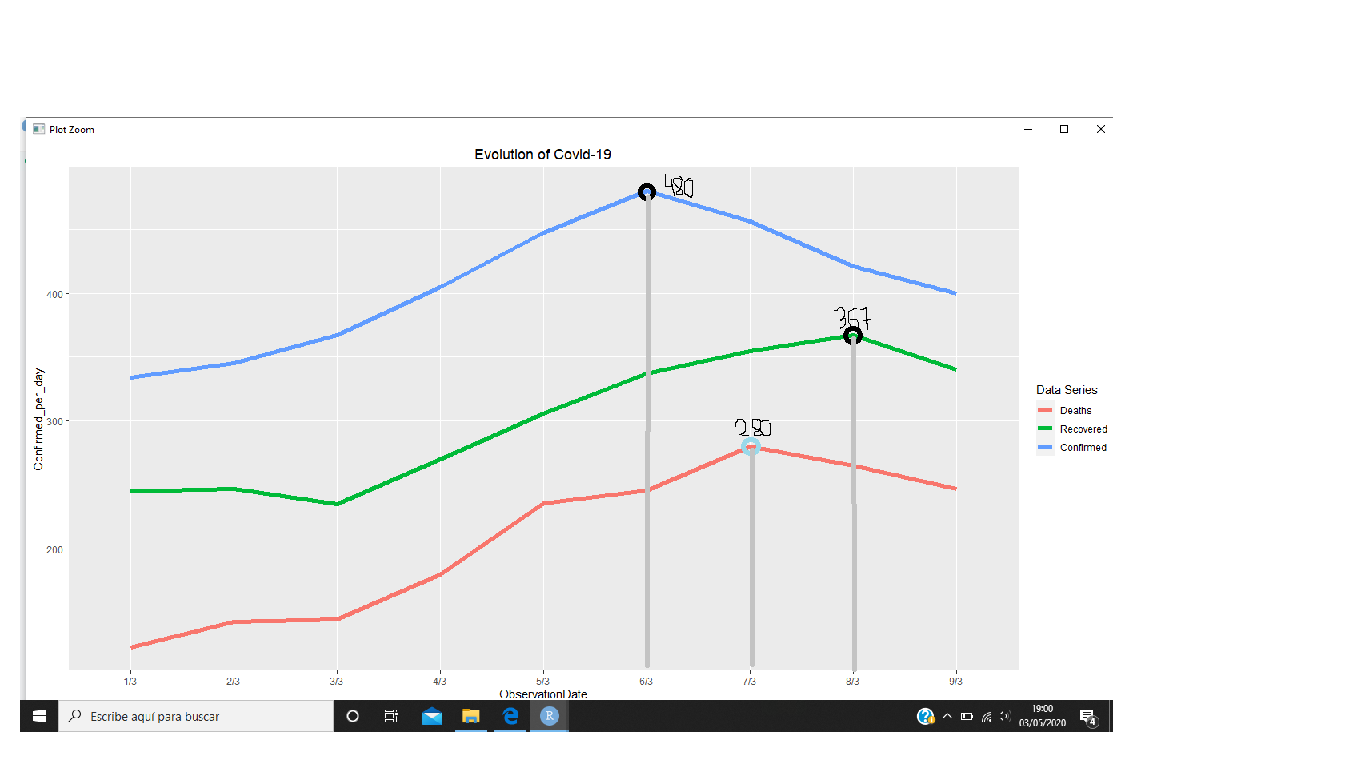
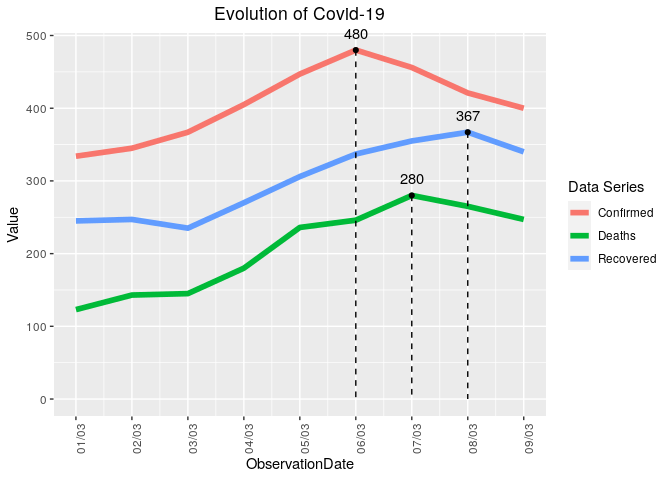
1- My main problem is that I´d like to point only the max value of "y" in the 3 lines. I am trying something like: "+ geom_point(max(y))
2-Secondly I´d line to put kind of abline in each of the lines that connect this point with its x value
3-If its not too much, just with geom_text() put the "y" value in each point automatically.
Here is the code. If anyone can help me with something of that, I´d be so much grateful…
Rubén.
#CODE
ObservationDate <- c("1/3", "2/3", "3/3","4/3","5/3","6/3","7/3","8/3","9/3")
Confirmed_per_day <- c(334,345,367,405,447,480,456,421,400)
Deaths_per_day <- c(123,143,145,180,236,246,280,265,247)
Recovered_per_day <- c(245,247,235,270,306,337,355,367,340)
coronavirus_daily_Spain <- data.frame(ObservationDate,Confirmed_per_day,Deaths_per_day,Recovered_per_day)
View(coronavirus_daily_Spain)
#GRAPH
library(ggplot2)
q <- ggplot(data=coronavirus_daily_Spain, aes(x=ObservationDate))+
geom_line(aes(y = Confirmed_per_day, group=1, color = "steelblue"), size=2) +
geom_line(aes(y = Deaths_per_day, group=1, color = "darkred"), size=2) +
geom_line(aes(y = Recovered_per_day, group=1, color = "green"), size=2) +
scale_color_discrete(name = "Data Series", labels = c("Deaths", "Recovered", "Confirmed"))
q + theme(axis.text.x = element_text(angle = 90, hjust = 1))
print(q + ggtitle("Evolution of Covid-19") + theme(plot.title = element_text(hjust = 0.5)))