Hello,
I am trying to do a stacked bar chart with the following code:
decil<- c(1,2,3,4,5,6,7,8,9,10,1,2,3,4,5,6,7,8,9,10)
per <- c(3,4,5,6,7,3,2,8,5,6,7,3,2,4,5,2,9,7,5,6)
pob <- c("Esp", "Esp", "Esp","Esp","Esp","Esp","Esp","Esp","Esp","Esp","Ext","Ext","Ext","Ext","Ext","Ext","Ext","Ext","Ext","Ext")
dat <- data.frame(decil, per, pob)
ggplot(dat, aes(x = decil, y = per, fill = pob)) +
  geom_col(position="identity")  +
  ylab("Porcentaje") +
  xlab(NULL) + ylim(0, 30) +coord_flip()
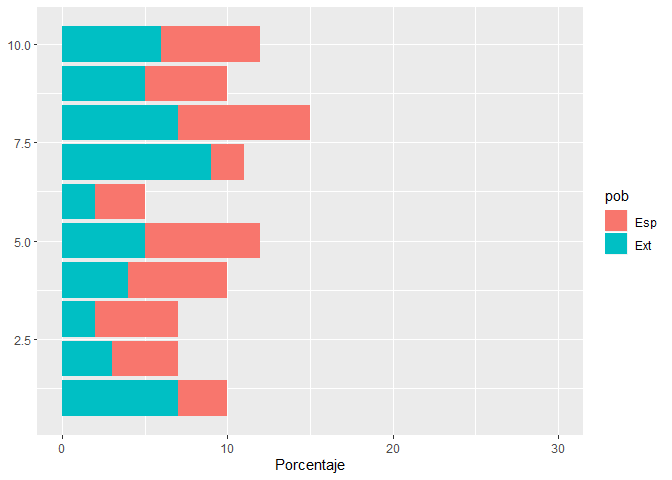
However, only some of the columns appear with the stacked variable, leading to the following plot:
I do not why this happens, and would greatly appreciate any feedback on why it does.