Hi,
I've made an histogram with a density line like this:
wingspan <- (lenght=100)
for(g in 1:100){
wingspan[g] <- mean(sample(D, size=5))
}
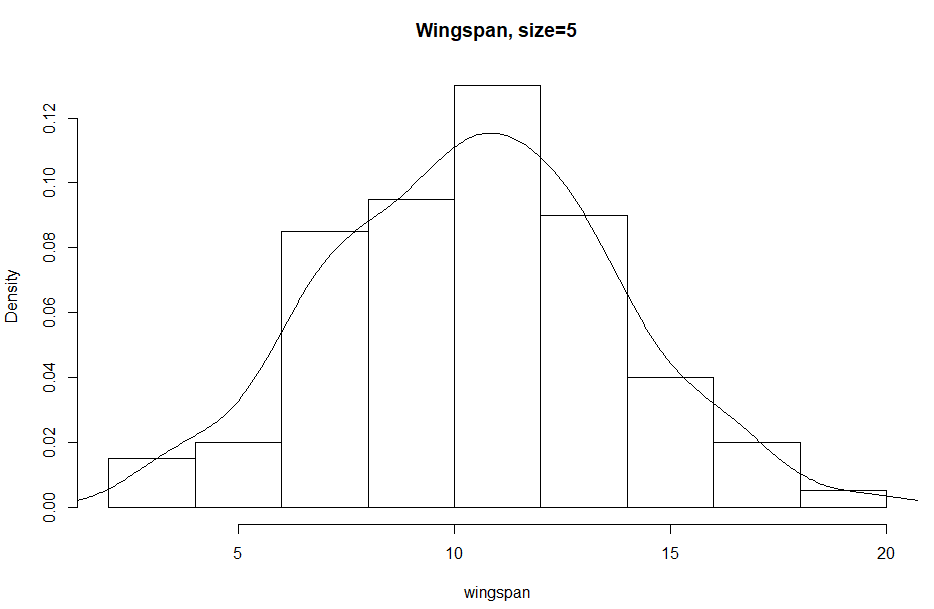
hist(wingspan, prob=TRUE, main="Wingspan, size=5")
lines(density(wingspan))
Is possible to make the line more linear? (I've read something with "bw=" but I'm not able to use it...)
I mean... if is possible to make it seen more like a gaussian curve and not like now...
Sorry for bad English, I hope you will understand!
Bye, Simone
Do you mean that you don’t know how to use this parameter, or that you are not supposed to use this parameter (for instance, according to the rules of an assignment)?
The bw parameter either selects the algorithm for choosing a bandwidth based on your data (if you give it one of a set of pre-defined character strings corresponding to the methods described here), or you can directly supply a bandwidth you have chosen separately by passing it a number.
As you increase bandwidth, your kernel density estimate will get smoother, which I think is what you are looking for? However, be careful — an overly smooth density estimate may obscure genuine features in the underlying data.
As you can read about in the documentation, density() also has an adjust parameter that lets you apply a multiplier to the bandwidth, without changing the bandwidth estimation method. This might be easier to use than bw.
# half of the bandwidth chosen by the default method
density(data, adjust = 0.5)

# twice the bandwidth chosen by the default method
density(data, adjust = 2)
More about kernel density estimation...
There are lots of good discussions of how kernel density estimation works and what the bandwidth means out there. Here are a few that I’ve found helpful:
An introduction to kernel density estimation
Histograms and kernel density estimation KDE 2 | Biophysics and Beer
Statistical Analysis Handbook 2018 edition - Dr M J de Smith
3 Likes