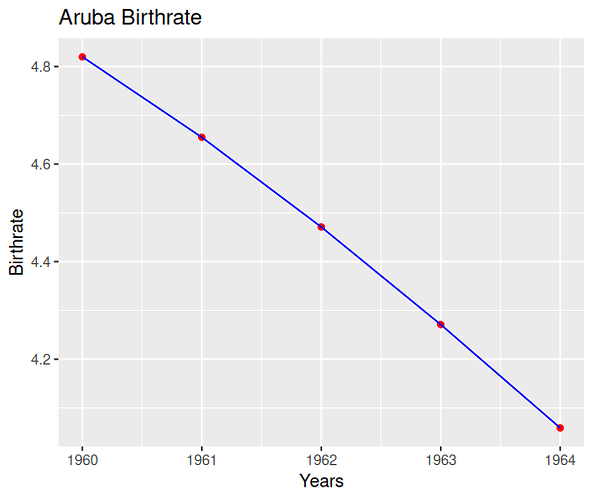
I am having a problem converting a working string of code into a function.
It looks like I am messing up in specifying the function variable in the function code. Presumably I am doing something stupid bet I can't see it.
Sample data is at the bottom of the message. Note I am using {data.table}
Thanks
suppressMessages(library(data.table));
suppressMessages(library(tidyverse))
setDF(DT1) # Convert data.frame to data.table

## Working Code
cty <-  DT1[country_code == "ABW"]
nation <- paste(as.character(cty[1, 1]), "Birthrate")

cty_names <- names(cty)
cty_names <- cty_names[3:length(cty_names)]
cty_names <-  sub(".", "", cty_names) |> as.numeric()

cty_br <- unlist(cty[1,])
cty_br <- cty_br[3:length(cty_br)] |> as.numeric()

target <- data.table(cty_names, cty_br)

ggplot(target, aes(cty_names, cty_br)) +
  geom_point(colour = "red") + geom_line(group = 1, colour ="blue")  +
  labs(title = nation, x = "Years", y = "Birthrate")


## Not-working function
myplot <- function(my_country){

  cty <-  DT[country_code == "my_country"]
  nation <- paste(as.character(cty[1, 1]), "Birthrate")

  cty_names <- names(cty)
  cty_names <- cty_names[3:length(cty_names)]
  cty_names <-  sub(".", "", cty_names) |> as.numeric()

  cty_br <- unlist(cty[1,])
  cty_br <- cty_br[3:length(cty_br)] |> as.numeric()

  target <- data.table(cty_names, cty_br)

  ggplot(target, aes(cty_names, cty_br)) +
    geom_point(colour = "red") + geom_line(group = 1, colour ="blue")  +
    labs(title = nation, x = "Years", y = "Birthrate")

}

myplot(ABW)
Sample Data
DT1 <- structure(list(country_name = c("Aruba", "Africa Eastern and Southern",

                                       "Afghanistan", "Africa Western and Central", "Angola", "Albania",

                                       "Andorra", "Arab World", "United Arab Emirates", "Argentina",

                                       "Armenia", "American Samoa", "Antigua and Barbuda", "Australia",

                                       "Austria", "Azerbaijan", "Burundi", "Belgium", "Benin", "Burkina Faso",

                                       "Bangladesh", "Bulgaria"), country_code = c("ABW", "AFE", "AFG",

                                                                                   "AFW", "AGO", "ALB", "AND", "ARB", "ARE", "ARG", "ARM", "ASM",

                                                                                   "ATG", "AUS", "AUT", "AZE", "BDI", "BEL", "BEN", "BFA", "BGD",

                                                                                   "BGR"), y1960 = c(4.82, 6.72322577683399, 7.282, 6.45906325929944,

                                                                                                     6.708, 6.455, NA, 6.92532650587424, 6.718, 3.075, 4.786, NA,

                                                                                                     4.602, 3.453, 2.69, 5.878, 7.003, 2.54, 6.282, 6.248, 6.784,

                                                                                                     2.31), y1961 = c(4.655, 6.74212391533005, 7.284, 6.47209862023661,

                                                                                                                      6.79, 6.353, NA, 6.97349319481517, 6.678, 3.069, 4.67, NA, 4.559,

                                                                                                                      3.54, 2.78, 5.937, 7.023, 2.63, 6.402, 6.286, 6.831, 2.29), y1962 = c(4.471,

                                                                                                                                                                                            6.76234266665616, 7.292, 6.49239470136811, 6.872, 6.207, NA,

                                                                                                                                                                                            7.068162514806, 6.659, 3.106, 4.521, NA, 4.547, 3.442, 2.8, 5.961,

                                                                                                                                                                                            7.038, 2.59, 6.457, 6.322, 6.865, 2.24), y1963 = c(4.271, 6.7781328342706,

                                                                                                                                                                                                                                               7.302, 6.50652816532602, 6.954, 6.047, NA, 7.06315409593758,

                                                                                                                                                                                                                                               6.619, 3.101, 4.345, NA, 4.536, 3.332, 2.82, 5.945, 7.067, 2.68,

                                                                                                                                                                                                                                               6.51, 6.356, 6.841, 2.21), y1964 = c(4.059, 6.78782143731601,

                                                                                                                                                                                                                                                                                    7.304, 6.52552945628155, 7.036, 5.849, NA, 7.05309784978593,

                                                                                                                                                                                                                                                                                    6.573, 3.08, 4.15, NA, 4.484, 3.146, 2.79, 5.888, 7.09, 2.71,

                                                                                                                                                                                                                                                                                    6.565, 6.419, 6.837, 2.19)), row.names = c(NA, -22L), class = "data.frame")

