Good morning, everyone,
I made a factor map from new generation sequencing results (large datasets), following this procedure:
library(FactoMineR)
1. ACP
res.pca <- PCA(USArrests, ncp = 3, graph = FALSE)
2. HCPC
res.hcpc <- HCPC(res.pca, graph = FALSE)
Factor map
fviz_cluster(res.hcpc, repel = TRUE, show.clust.cent = TRUE, palette = "jco", ggtheme = theme_minimal(),main = "Factor map")
I don't know if this is possible (maybe by combining other dimensions, like dim1 vs dim3), to be able to distinguish clusters 1, 2, 4 from clusters 3,5 at the level of the diagonal I drew in red on the graph below.
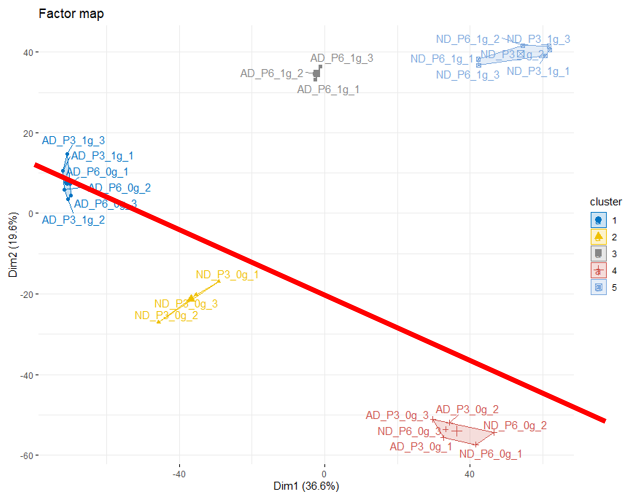
From there, I would have liked to know which of the factors (genes) allow us to make this distinction?
Thank you very much to all the people who will be able to help me !
Have a nice day