Hello,
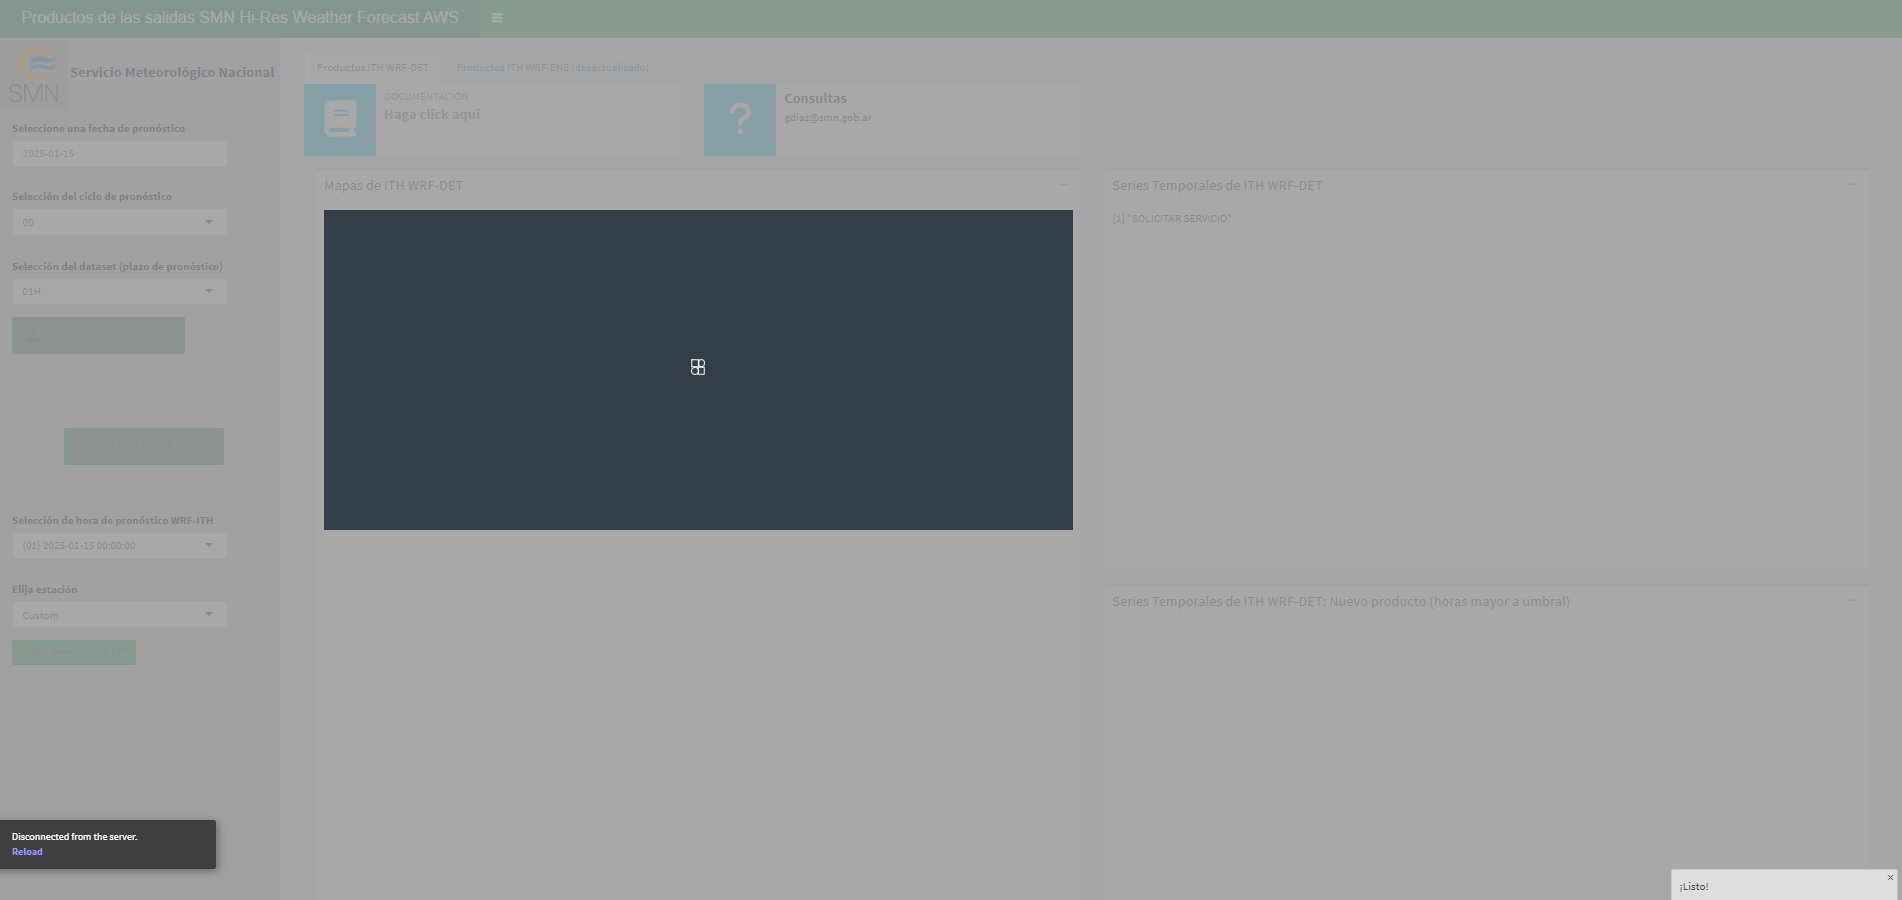
I am having problem with one application that is loaded in shinyapps.io. When I run it locally everything is ok, but when I put it in shinyapps.io crashes.
library("aws.s3")
library("ncdf4")
library("sp")
library("sf")
library("dplyr")
library("shiny")
library("shinyWidgets")
library("shinydashboard")
library("waiter")
library("leaflet")
library("rlist")
library("graphics")
library("fields")
library("raster")
library("RColorBrewer")
library("purrr")
library("ggplot2")
library("png")
library("patchwork")
library("DT") # librería para las fcs: dataTableOutput() y renderDataTable()
library("tidyr")
library("xts")
library("dygraphs")
library("viridis")
library("terra")
library("lubridate")
#Sys.setenv(TZ = "America/Argentina/Buenos_Aires")
------------------------------------------------------------------------------
Funciones utilizadas en la app
source("./00_fct.R")
source("./00_fct-ITH.R")
------------------------------------------------------------------------------
Configuracion de UI
ui <- dashboardPage(skin = "green",
dashboardHeader(title = "Productos de las salidas SMN Hi-Res Weather Forecast AWS",
titleWidth = 600),
dashboardSidebar(
tags$style(HTML("
  /* Cambiar el color de fondo del sidebar */
  .main-sidebar {
    background-color: #CDCDCD !important; /* Color tonalidad gris */
    }")),

sidebarMenu(

  waiter::use_waiter(),


  tags$div(
    style = "display: inline-block; background-color: #BBBBBB; padding: 5px;",
    tags$img(src = "logoSMN-75x80.png", width = "75px")),

  tags$span(style = "color: #000046; font-size: 18px; font-weight: bold;",
            "Servicio Meteorológico Nacional"),

  dateInput("fecha.tab1", label = div(style = "color: black;",
                                      "Seleccione una fecha de pronóstico"),
            value = as.Date("2025-01-15"),
            min = as.Date("2025-01-01"),
            max = as.Date("2025-01-15")),

  selectInput("ciclo.tab1",
              label = div(style = "color: black;", "Selección del ciclo de pronóstico"),
              choices = c("00", "06", "12", "18"),
              selected = "00"),

  selectInput("time.tab1",
              label = div(style = "color: black;", "Selección del dataset (plazo de pronóstico)"),
              choices = c("24H", "01H"),
              selected = "24H"),

  actionButton("descarga", "DESCARGA DE DATOS",
               style = "background-color: #3F704D",
               class = "btn-lg btn-success",
               icon = icon("download")),

  tags$br(), tags$br(), tags$br(), tags$br(),

  tags$div(
    style = "display: flex; justify-content: center; align-items: center; height: 100%",
    actionButton("Calcular_ith", "Calcular ITH-WRF-DET",
                 style = "background-color: #3F704D",
                 class = "btn-lg btn-success")),

  tags$br(),

  uiOutput("tabSelection")

  ), width = 350
),
dashboardBody(fluidPage(
tabsetPanel(id="tabs1",
  tabPanel("Productos ITH WRF-DET", value = 2,
           fluidRow(
             column(width=3, tags$a(
             href = "https://repositorio.smn.gob.ar/bitstream/handle/20.500.12160/2875/Nota_Tecnica_SMN_2024-182.pdf?sequence=1&isAllowed=y",
             target = "_blank",
             infoBox("Documentación", "Haga click aquí", icon = icon("book"), width = "100%"))),

             column(width=3, infoBox("", "Consultas", "gdiaz@smn.gob.ar", width="100%", icon=icon("question")))),

           box(title = "Mapas de ITH WRF-DET",
               collapsible = TRUE, width = 6,
               imageOutput("image_ith"), height = "1000px"),
           box(title = "Series Temporales de ITH WRF-DET",
               collapsible = TRUE, width = 6, height = 500,
               textOutput("plot_ith")),
           box(title = "Series Temporales de ITH WRF-DET: Nuevo producto (horas mayor a umbral)",
               collapsible = TRUE, width = 6, height = 500,
               imageOutput("plot_new_ith")),
           box(title = "Mapas interactivo",
               collapsible = TRUE, width = 6,
               leafletOutput("leaflet_ith", height = "1000px"))
           ),
  tabPanel("Productos ITH WRF-ENS (desactualizado)", value = 2,
           fluidRow(
             column(width=3, tags$a(
             href = "https://repositorio.smn.gob.ar/bitstream/handle/20.500.12160/2875/Nota_Tecnica_SMN_2024-182.pdf?sequence=1&isAllowed=y",
             target = "_blank",
             infoBox("Documentación", "Haga click aquí", icon = icon("book"), width = "100%"))),

             column(width=3, infoBox("", "Consultas", "gdiaz@smn.gob.ar", width = "100%", icon = icon("question")))),

           box(title = "Mapas de probabilidad de ITH WRF-ENS",
               collapsible = TRUE, width = 10, height = 500,
               imageOutput("image_ith_ens")),
           box(title = "Series Temporales de ITH WRF-ENS",
               collapsible = TRUE, width = 6, height = 800,
               imageOutput("plot_ith_ens"))
  )
  )
)
)
)
server <- function(input, output, session) {
dialogo al inicio de app
source(file = "./00_dialogue.R", local = TRUE)
abre archivos estáticos
sa <- read_sf("./shp_SA/", "SA")
logo <- readPNG("./www/logoSMN-75x80.png", native = TRUE)
UI según selección de dataset
output$variable <- renderUI({
if (input$time.tab1 == "01H")
{opts <- c("PP", "HR2", "T2", "dirViento10", "magViento10", "PSFC",
           "TSLB", "SMOIS")}

if (input$time.tab1 == "24H")
{opts <- c("Tmax", "Tmin")}

selectInput("variable",
            label = div(style = "color: black;", "Seleccione la variable del dataset:"), choices = opts)
})
UI del 2do TAB
output$tabSelection <- renderUI({
sidebarMenu(

  tags$br(),

  selectInput("time_ith", label = div(style = "color: black;", "Selección de hora de pronóstico WRF-ITH"),
              choices = paste0("(", sprintf("%02d", seq(1, 72, 1)), ")", " ",
                               seq(strptime(as.character(paste0(input$fecha.tab1, "T", input$ciclo.tab1)),
                                            format = "%Y-%m-%dT%H"),
                                   by = "hour",
                                   length.out = 72))),

  selectInput("estaciones", div(style = "color: black;", "Elija estación"),
              choices = c("Custom", "Sunchales", "Reconquista", "Ceres")),

  actionButton("ith_srs", "Grafica Serie ITH-WRF-DET", class = "btn-sm btn-success"))
})
file.for.points <- reactiveVal(NULL)
observeEvent(input$descarga, {
# elimina los archivos netcdf descargados
unlink(Sys.glob("*.nc"))
showNotification("La descarga de archivos se encuentra en proceso", duration = 7)

s <- get.wrf.files(anual = format(input$fecha.tab1, "%Y"),
              mes =format(input$fecha.tab1, "%m"),
              dia = format(input$fecha.tab1, "%d"),
              ciclo = input$ciclo.tab1,
              time = input$time.tab1)

showNotification("¡Listo!", duration = NULL)

file.for.points(substr(s$Key, 28, 58))
})
resp.2 <- eventReactive(input$Calcular_ith, {
tryCatch({
  # waiter en pantalla
  waiter::Waiter$new(html = spin_square_circle(), id = "image_ith")$show()

  folder.data <- "./"

  ith.calc <- ith.wrf.det(path.data = folder.data,
                          anual = format(input$fecha.tab1, "%Y"),
                          mes = format(input$fecha.tab1, "%m"),
                          dia = format(input$fecha.tab1, "%d"),
                          ciclo = input$ciclo.tab1)


}, error = function(e) {
  showNotification(paste("Error:", e$message), type = "error", duration = NULL)
  print(e)
  return(NULL)
})
})
----------------------------------------------------------------------------
OUTPUTS
OUTPUT TAB 1
OUTPUT PLOT METEOROLOGICAL VARIABLE
source(file = "./01a_plot_tab1.R", local = TRUE)
OUTPUT LEAFLET LOCATION
source(file = "./01b_leaflet_tab1.R", local = TRUE)
OUTPUT DATA TABLE METEOROLOGICAL VARIABLE
source(file = "./01c_table_tab1.R", local = TRUE)
----------------------------------------------------------------------------
OUTPUT TAB 2
OUTPUT MAP IMAGE ITH
source(file = "./02a_map_ith_tab2.R", local = TRUE)
OUTPUT TIME SERIES ITH
output$plot_ith <-renderPrint({print("SOLICITAR SERVICIO")})
source(file = "./02b_timeseries_ith_tab2.R", local = TRUE)
OUTPUT TIME SERIES ITH: NEW PRODUCT
source(file = "./02c_timeseries_ith_new_tab2.R", local = TRUE)
----------------------------------------------------------------------------
OUTPUT TAB 3
OUTPUT PROBABILITIES MAPS IMAGES & TIMESERIES ITH
source(file = "./03_map_timeseries_ith_tab3.R", local = TRUE)
----------------------------------------------------------------------------
}
shinyApp(ui = ui, server = server)
Could anyone help me to solve this??
Thank you,
- Lorena