Hey all,
I have the following code below!
I am trying to do 3 things:
- Change the distance between the X/Y-axis and their respective labels and centre the title of the graph
- Change the rotation angle of the tick labels on the X-axis to 45 degrees
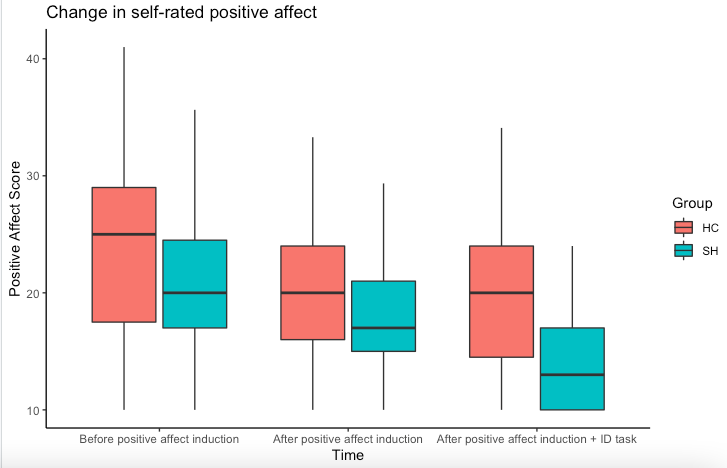
- Bolden the font of the x and y-axis labels and of the legend title
positiveplot = ggplot(positiveaffect, aes(x=factor(Time), y=Scores, fill = Group)) + geom_boxplot(outlier.shape = NA) + labs(title="Change in self-rated positive affect", x="Time", y = "Positive Affect Score") + theme(legend.title = element_text(face = "bold"), plot.title = element_text(hjust = 0.5), axis.text.x = element_text((vjust = -2), angle = 45), axis.text.y = element_text(vjust = -2)) + scale_x_discrete(labels=labelspositive) + theme_classic()
The output I get is as follows:
Would anybody be able to give me a helping hand and let me know what I'm doing wrong?
Minimal reproducible example:
structure(list(Group = c("SH", "SH", "SH", "SH", "SH", "SH",
"SH", "SH", "SH", "SH", "SH", "SH", "SH", "SH", "SH", "SH", "SH",
"SH", "SH", "SH", "SH", "SH", "SH", "SH", "SH", "SH", "SH", "SH",
"SH", "SH", "SH", "SH", "SH", "SH", "SH", "SH", "SH", "SH", "SH",
"SH", "SH", "SH", "SH", "SH", "SH", "SH", "SH", "SH", "SH", "SH",
"SH", "SH", "SH", "SH", "SH", "SH", "SH", "SH", "SH", "SH", "SH",
"SH", "SH", "SH", "SH", "SH", "SH", "SH", "SH", "SH", "SH", "SH",
"SH", "SH", "SH", "SH", "SH", "SH", "SH", "SH", "SH", "SH", "SH",
"SH", "SH", "SH", "HC", "HC", "HC", "HC", "HC", "HC", "HC", "HC",
"HC", "HC", "HC", "HC", "HC", "HC", "HC", "HC", "HC", "HC", "HC",
"HC", "HC", "HC", "HC", "HC", "HC", "HC", "HC", "HC", "HC", "HC",
"HC", "HC", "HC", "HC", "HC", "HC", "HC", "HC", "HC", "HC", "HC",
"HC", "HC", "HC", "HC", "HC", "HC", "HC", "HC", "HC", "HC", "HC",
"HC", "HC", "HC", "HC", "HC", "HC", "HC", "HC", "HC", "HC", "HC",
"HC", "HC", "HC", "HC", "HC", "HC"), Time = c(1, 1, 1, 1, 1,
1, 1, 1, 1, 1, 1, 1, 1, 1, 1, 1, 1, 1, 1, 1, 1, 1, 1, 1, 1, 1,
1, 1, 2, 2, 2, 2, 2, 2, 2, 2, 2, 2, 2, 2, 2, 2, 2, 2, 2, 2, 2,
2, 2, 2, 2, 2, 2, 2, 2, 2, 2, 3, 3, 3, 3, 3, 3, 3, 3, 3, 3, 3,
3, 3, 3, 3, 3, 3, 3, 3, 3, 3, 3, 3, 3, 3, 3, 3, 3, 3, 1, 1, 1,
1, 1, 1, 1, 1, 1, 1, 1, 1, 1, 1, 1, 1, 1, 1, 1, 1, 1, 1, 1, 2,
2, 2, 2, 2, 2, 2, 2, 2, 2, 2, 2, 2, 2, 2, 2, 2, 2, 2, 2, 2, 2,
2, 3, 3, 3, 3, 3, 3, 3, 3, 3, 3, 3, 3, 3, 3, 3, 3, 3, 3, 3, 3,
3, 3, 3), Scores = c(18, 24, 31, 11, 14, 23, 17, 32, 19, 10,
35.6378909726158, 16, 22, 19, 19, 23, 20, 34, 17, 29, 12, 20,
16, 30, 26, 18, 21, 20, 15, 28, 29.3521832998335, 16, 10, 15,
17, 21, 14, 23, 12, 28, 17, 22, 13, 17, 13, 17, 16, 18, 19, 11,
17, 16, 24, 20, 22, 19, 18, 18, 15, 28.0883375096763, 20, 10,
11, 13, 10, 28.0883375096763, 16, 11, 22, 10, 16, 10, 13, 12,
16, 16, 15, 17, 10, 10, 10, 10, 13, 10, 18, 24, 26, 41, 25, 32,
13, 13, 28, 10, 24, 32, 36, 17, 16, 25, 38, 27, 28, 18, 14, 18,
30, 27, 24, 19, 33.2978283948586, 24, 24, 14, 20, 20, 10, 22,
15, 12, 24, 20, 26, 21, 20, 17, 11, 24, 10, 21, 24, 27, 22, 34.0925216652814,
24, 25, 12, 15, 24, 18, 23, 27, 14, 13, 11, 21, 25, 20, 22, 15,
11, 17, 10, 20, 27), ID = c("1222", "1992j", "1992i", "1592",
"1602", "1192", "1852", "1422", "1732", "1999", "1924", "1812",
"1752", "1762", "1782", "19992", "1892", "199912", "190", "171",
"199924", "1912", "199943", "1982", "1802", "3812", "199945",
"197", "1492", "1222", "1992j", "1992i", "1592", "1602", "1192",
"1852", "1422", "1732", "1999", "1924", "1812", "1752", "1762",
"1782", "19992", "1892", "199912", "190", "171", "199924", "1912",
"199943", "1982", "1802", "3812", "199945", "197", "1492", "1222",
"1992j", "1992i", "1592", "1602", "1192", "1852", "1422", "1732",
"1999", "1924", "1812", "1752", "1762", "1782", "19992", "1892",
"199912", "190", "171", "199924", "1912", "199943", "1982", "1802",
"3812", "199945", "197", "3212", "3182", "3162", "3412", "3492",
"1993", "363", "3362", "3122", "3152", "1997", "19995", "330",
"370", "3999", "19998", "375", "374", "373", "377", "379", "380",
"382", "3212", "3182", "3162", "3412", "3492", "1993", "363",
"3362", "3122", "3152", "1997", "19995", "330", "370", "3999",
"19998", "375", "374", "373", "377", "379", "380", "382", "3212",
"3182", "3162", "3412", "3492", "1993", "363", "3362", "3122",
"3152", "1997", "19995", "330", "370", "3999", "19998", "375",
"374", "373", "377", "379", "380", "382")), row.names = c(NA,
-155L), class = c("tbl_df", "tbl", "data.frame"))
# A tibble: 100 x 4
   Group  Time Scores ID
   <chr> <dbl>  <dbl> <chr>
 1 SH        1     18 1222
 2 SH        1     24 1992j
 3 SH        1     31 1992i
 4 SH        1     11 1592
 5 SH        1     14 1602
 6 SH        1     23 1192
 7 SH        1     17 1852
 8 SH        1     32 1422
 9 SH        1     19 1732
10 SH        1     10 1999
# … with 90 more rows
