Problem with a simple multiple line graph using ggplot2

Hi,
I have a potentially simple problem with a multiple line plot. The problem with the plot is that I want to reduce the size of the lines so that they do not overlap with each other. Now here is the problem I have already used the size and lwd commands but that doesn't seem to help. What I want is the lines not to overlap and be more visible. I will also upload an image of the plot I got , if it helps I can also upload the exel data file. Rplot05 The code I used is :

library (readxl)
setwd("C:/Users/30693/Desktop/LousoiSM2")
RGB=readxl::read_xlsx("values.xlsx")

min_Depth=0
max_Depth=7
min_Red=13
max_Red=212.226
min_Green=10
max_Green=200
min_Blue=3
max_Blue=180

library(ggplot2)
attach(RGB)

ggplot()+
geom_line(data= RGB, aes(x=Depth, y=Red),col="Red")+
geom_line(data= RGB, aes(x=Depth, y=Green),col="Green")+
geom_line(data= RGB, aes(x=Depth, y=Blue),col="Blue")+
labs(x=NULL, y= "RGB Profile") +
scale_x_continuous(breaks=NULL) + scale_y_continuous(expand = c(0, 0),breaks =seq(min_Red, max_Red, 212.226)) +
coord_cartesian(ylim=c(13,212.226))+
theme(axis.text.y = element_text(angle = 90)) +
theme(axis.title.x=element_blank(), axis.text.x=element_blank(), axis.ticks.x=element_blank()) +
theme(aspect.ratio=1.5/10) +
theme(panel.background = element_rect(fill = "transparent",colour = NA),
panel.grid.minor = element_blank(),
panel.grid.major = element_blank()) +
geom_hline(yintercept=13, col="black") +
geom_vline(xintercept=7) +
geom_vline(xintercept=0) +
geom_hline(yintercept=212.226)

Hi!

To help us help you, could you please turn this into a proper reproducible example (reprex) illustrating your issue? Please have a look at this guide, to see how to create one:

Hi Mr. andresrcs,
I appreciate the fast response. Before I start making the necessary data frame I would like to ask a question. Because the plot has to do with RGB values the excel file is comprised of 10853 rows and 4 columns (Depth (m), Red, Green,Blue). The problem with the data frame lies with its size, because of the high analysis, for example:
Depth Red Green Blue
0 | 107 71 49
0.00066 | 103 68 46
0.00132 | 99 65 39.0
0.00198 | 91.0 60.0 34.0
0.00265 | 82.0 52.0 30.0
0.00331 | 71.0 42.0 23.0

As you can see the depth column is comprised of values with 5 decimals, so if I try to make a data frame that would be somewhat acceptable as reproducible, it would be a data frame with at least 1000 rows. One more thing the tibble ::tribble command exports the data frame as rows instead of columns could you help me on that as well?
P.S
Sorry for increasing your workload on a Friday night.

I think it would be quite acceptable to provide a sample of the data. I would suggest that you do something like

dput(head(mydata, 100)) 

where mydata is the name of your data.frame or tibble.
Then paste the output here. That will give us the first hundred rows of your data.

It may be more efficient to convert your data to long format and then plot it.

here is a simple example using the data you supplied.

library(tidyverse)
dat1  <-  structure(list(Depth = c(0, 0.00066, 0.00132, 0.00198, 0.00265, 
0.00331), Red = c(107, 103, 99, 91, 82, 71), Green = c(71, 68, 
65, 60, 52, 42), Blue = c(49, 46, 39, 34, 30, 23)), class = "data.frame", row.names = c(NA, 
-6L))

dat2  <-  dat1   %>%  pivot_longer(c(Red, Blue, Green),  names_to = "colours",
                      values_to = "values")
                      

ggplot(dat2, aes(Depth, values, colour = colours)) + 
       geom_line()

Ok I managed to make the data frame, but after using the reprex function Rstudio tells me two things: Where is the reprex source? and what is the target venue? and it gives me a few choices, so how do I upload it ?

Thanks in advance

Ps
If I don't upload the original code would that be a problem, because I uploaded it in my first post ?

Not a problem.

Do not use reprex It is not needed.

Do

dput(head(mydata, 100)) 

where mydata is the name of your data.frame or tibble.
Then paste the output here. That will give us the first hundred rows of your data.

Wouldn't this require your data to not overlap ?

I think I did it (hopefully).
structure(list(Depth = c("0", "0,00066", "0,00132", "0,00198",
"0,00265", "0,00331", "0,00397", "0,00463", "0,00529", "0,00595",
"0,00661", "0,00728", "0,00794", "0,0086", "0,00926", "0,00992",
"0,01058", "0,01124", "0,01191", "0,01257", "0,01323", "0,01389",
"0,01455", "0,01521", "0,01588", "0,01654", "0,0172", "0,01786",
"0,01852", "0,01918", "0,01984", "0,02051", "0,02117", "0,02183",
"0,02249", "0,02315", "0,02381", "0,02447", "0,02514", "0,0258",
"0,02646", "0,02712", "0,02778", "0,02844", "0,0291", "0,02977",
"0,03043", "0,03109", "0,03175", "0,03241", "0,03307", "0,03373",
"0,0344", "0,03506", "0,03572", "0,03638", "0,03704", "0,0377",
"0,03837", "0,03903", "0,03969", "0,04035", "0,04101", "0,04167",
"0,04233", "0,043", "0,04366", "0,04432", "0,04498", "0,04564",
"0,0463", "0,04696", "0,04763", "0,04829", "0,04895", "0,04961",
"0,05027", "0,05093", "0,05159", "0,05226", "0,05292", "0,05358",
"0,05424", "0,0549", "0,05556", "0,05622", "0,05689", "0,05755",
"0,05821", "0,05887", "0,05953", "0,06019", "0,06086", "0,06152",
"0,06218", "0,06284", "0,0635", "0,06416", "0,06482", "0,06549"
), Red = c("107", "103", "99", "91,001", "82,002", "71,003",
"72", "80,997", "81", "76,002", "60,008", "57,002", "69,993",
"91,986", "92,999", "91,001", "89,002", "85,003", "75,009", "68,006",
"80,988", "91,989", "105,985", "109,996", "114,994", "111,005",
"98,016", "83,019", "78,007", "80,996", "85,993", "77,013", "75,003",
"72,005", "81,984", "84,995", "71,024", "50,037", "36,025", "34,004",
"39,989", "48,983", "61,974", "67,988", "68,998", "80,974", "93,972",
"94", "95,995", "99,991", "101,995", "110,978", "113,993", "112,005",
"104,02", "101,008", "101", "101", "101", "104,989", "102,009",
"", "99,018", "91,024", "76,045", "62,043", "57,016", "70,956",
"92,929", "111,938", "123,96", "123,003", "103,068", "86,059",
"87,993", "93,979", "97,986", "109,956", "122,952", "124,993",
"123,008", "102,08", "79,089", "57,086", "49,032", "53,98", "60,972",
"72,951", "86,942", "99,945", "101,991", "103,991", "107,983",
"108", "103,022", "95,036", "88,032", "93,973", "99,972", "98,009"
), Green = c("71", "68", "65", "60,001", "52,002", "42,002",
"43,999", "51,997", "53", "47,003", "33,007", "31,001", "40,994",
"62,986", "65,998", "66", "65,001", "61,003", "52,008", "41,01",
"48,992", "56,992", "67,989", "73,993", "79,993", "78,002", "66,015",
"52,018", "48,005", "49,997", "55,991", "47,013", "45,003", "44,002",
"54,982", "59,992", "51,015", "33,031", "22,02", "20,004", "22,994",
"26,992", "35,982", "40,99", "41", "50,979", "61,976", "62",
"64,993", "69,988", "70,998", "76,986", "78,995", "79", "71,02",
"66,013", "65,003", "65", "65", "68,989", "66,009", "", "70,006",
"65,015", "51,042", "38,04", "31,022", "38,975", "55,945", "72,945",
"88,947", "89,997", "72,061", "54,062", "55,993", "61,979", "64,989",
"73,967", "87,948", "90,989", "91", "73,069", "52,081", "33,075",
"28,02", "29,992", "31,992", "40,963", "51,954", "64,945", "66,991",
"68,991", "72,983", "73", "67,027", "59,036", "53,027", "58,973",
"64,972", "62,014"), Blue = c("49", "46", "39,001", "34,001",
"30,001", "23,002", "24,999", "32,997", "34", "30,002", "17,006",
"14,002", "23,994", "42,988", "43", "42,001", "41,001", "38,002",
"31,006", "23,007", "31,991", "35,996", "43,992", "45,998", "51,993",
"51,001", "42,011", "30,015", "28,003", "30,996", "35,993", "28,012",
"27,002", "23,006", "33,982", "41,987", "38,007", "24,024", "12,022",
"6,011", "4,004", "5,996", "14,982", "19,99", "20", "30,977",
"41,976", "42", "41,002", "41,998", "42", "48,983", "51,993",
"52,997", "46,018", "43,008", "43", "43", "42,003", "44,992",
"42,009", "", "43,018", "39,012", "30,027", "23,021", "19,012",
"25,978", "35,968", "45,967", "53,974", "58,983", "46,044", "31,052",
"32,993", "40,972", "43,989", "53,964", "65,956", "70,981", "71",
"55,061", "35,077", "19,063", "15,016", "15,996", "16,996", "23,971",
"32,963", "43,954", "44,996", "46,991", "50,983", "51", "45,027",
"38,031", "33,023", "37,977", "42,977", "40,014")), row.names = c(NA,
100L), class = "data.frame")

You got it! Loads beautifully :grinning:.

I am on my way out so I will not have a chance to look at it for a while but with any luck someone else will be able to help.

Note to other readers the decimal is ",".

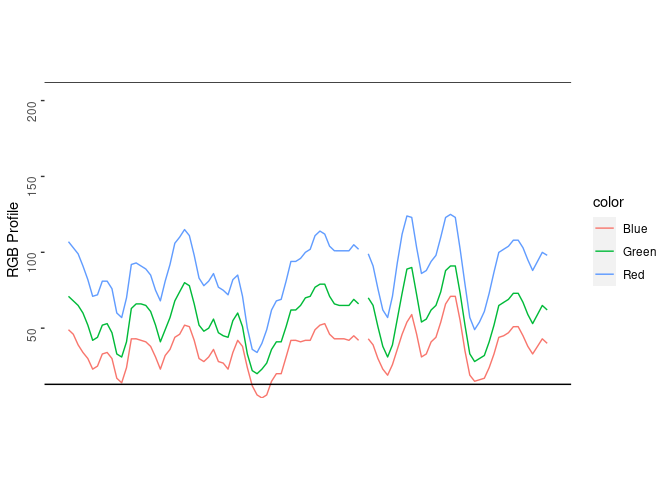
Your data doesn't seem to overlap, you are just compressing the Y axis too much with the aspect ratio you are setting.

See what happens if I change it:

library(tidyverse)

df <- data.frame(
  stringsAsFactors = FALSE,
             Depth = c("0","0,00066","0,00132",
                       "0,00198","0,00265","0,00331","0,00397","0,00463",
                       "0,00529","0,00595","0,00661","0,00728","0,00794","0,0086",
                       "0,00926","0,00992","0,01058","0,01124","0,01191",
                       "0,01257","0,01323","0,01389","0,01455","0,01521",
                       "0,01588","0,01654","0,0172","0,01786","0,01852",
                       "0,01918","0,01984","0,02051","0,02117","0,02183",
                       "0,02249","0,02315","0,02381","0,02447","0,02514","0,0258",
                       "0,02646","0,02712","0,02778","0,02844","0,0291",
                       "0,02977","0,03043","0,03109","0,03175","0,03241",
                       "0,03307","0,03373","0,0344","0,03506","0,03572",
                       "0,03638","0,03704","0,0377","0,03837","0,03903","0,03969",
                       "0,04035","0,04101","0,04167","0,04233","0,043",
                       "0,04366","0,04432","0,04498","0,04564","0,0463",
                       "0,04696","0,04763","0,04829","0,04895","0,04961",
                       "0,05027","0,05093","0,05159","0,05226","0,05292","0,05358",
                       "0,05424","0,0549","0,05556","0,05622","0,05689",
                       "0,05755","0,05821","0,05887","0,05953","0,06019",
                       "0,06086","0,06152","0,06218","0,06284","0,0635",
                       "0,06416","0,06482","0,06549"),
               Red = c("107","103","99","91,001",
                       "82,002","71,003","72","80,997","81","76,002",
                       "60,008","57,002","69,993","91,986","92,999","91,001",
                       "89,002","85,003","75,009","68,006","80,988","91,989",
                       "105,985","109,996","114,994","111,005","98,016",
                       "83,019","78,007","80,996","85,993","77,013","75,003",
                       "72,005","81,984","84,995","71,024","50,037",
                       "36,025","34,004","39,989","48,983","61,974","67,988",
                       "68,998","80,974","93,972","94","95,995","99,991",
                       "101,995","110,978","113,993","112,005","104,02",
                       "101,008","101","101","101","104,989","102,009",NA,
                       "99,018","91,024","76,045","62,043","57,016","70,956",
                       "92,929","111,938","123,96","123,003","103,068","86,059",
                       "87,993","93,979","97,986","109,956","122,952",
                       "124,993","123,008","102,08","79,089","57,086","49,032",
                       "53,98","60,972","72,951","86,942","99,945",
                       "101,991","103,991","107,983","108","103,022","95,036",
                       "88,032","93,973","99,972","98,009"),
             Green = c("71","68","65","60,001",
                       "52,002","42,002","43,999","51,997","53","47,003",
                       "33,007","31,001","40,994","62,986","65,998","66",
                       "65,001","61,003","52,008","41,01","48,992","56,992",
                       "67,989","73,993","79,993","78,002","66,015","52,018",
                       "48,005","49,997","55,991","47,013","45,003",
                       "44,002","54,982","59,992","51,015","33,031","22,02",
                       "20,004","22,994","26,992","35,982","40,99","41",
                       "50,979","61,976","62","64,993","69,988","70,998","76,986",
                       "78,995","79","71,02","66,013","65,003","65","65",
                       "68,989","66,009",NA,"70,006","65,015","51,042",
                       "38,04","31,022","38,975","55,945","72,945","88,947",
                       "89,997","72,061","54,062","55,993","61,979",
                       "64,989","73,967","87,948","90,989","91","73,069",
                       "52,081","33,075","28,02","29,992","31,992","40,963",
                       "51,954","64,945","66,991","68,991","72,983","73",
                       "67,027","59,036","53,027","58,973","64,972","62,014"),
              Blue = c("49","46","39,001","34,001",
                       "30,001","23,002","24,999","32,997","34","30,002",
                       "17,006","14,002","23,994","42,988","43","42,001",
                       "41,001","38,002","31,006","23,007","31,991","35,996",
                       "43,992","45,998","51,993","51,001","42,011",
                       "30,015","28,003","30,996","35,993","28,012","27,002",
                       "23,006","33,982","41,987","38,007","24,024","12,022",
                       "6,011","4,004","5,996","14,982","19,99","20",
                       "30,977","41,976","42","41,002","41,998","42","48,983",
                       "51,993","52,997","46,018","43,008","43","43",
                       "42,003","44,992","42,009",NA,"43,018","39,012",
                       "30,027","23,021","19,012","25,978","35,968","45,967",
                       "53,974","58,983","46,044","31,052","32,993","40,972",
                       "43,989","53,964","65,956","70,981","71","55,061",
                       "35,077","19,063","15,016","15,996","16,996","23,971",
                       "32,963","43,954","44,996","46,991","50,983","51",
                       "45,027","38,031","33,023","37,977","42,977",
                       "40,014")
)

min_Depth=0
max_Depth=7
min_Red=13
max_Red=212.226
min_Green=10
max_Green=200
min_Blue=3
max_Blue=180

df %>% 
    mutate(across(everything(), str_replace, ",", "."),
           across(everything(), parse_number)) %>% 
    pivot_longer(cols = -Depth, names_to = "color", values_to = "value") %>%
    ggplot(aes(x = Depth, y = value, color = color))+
    geom_line() +
    geom_hline(yintercept=13, col="black") +
    # geom_vline(xintercept=7) +
    # geom_vline(xintercept=0) +
    geom_hline(yintercept=212.226) +
    labs(x=NULL, y = "RGB Profile") +
    scale_x_continuous(breaks=NULL) +
    scale_y_continuous(expand = expansion(mult = 0)) +
    #coord_cartesian(ylim = c(13,212.226))+
    theme(axis.text.y = element_text(angle = 90),
          axis.title.x = element_blank(),
          axis.text.x = element_blank(),
          axis.ticks.x = element_blank(),
          aspect.ratio = 6/10,
          panel.background = element_rect(fill = "transparent",colour = NA),
          panel.grid.minor = element_blank(),
          panel.grid.major = element_blank())

Created on 2021-02-07 by the reprex package (v1.0.0)

If for some reason, changing the aspect ratio is not an option, you could try experimenting with scale transformations for the y axis.
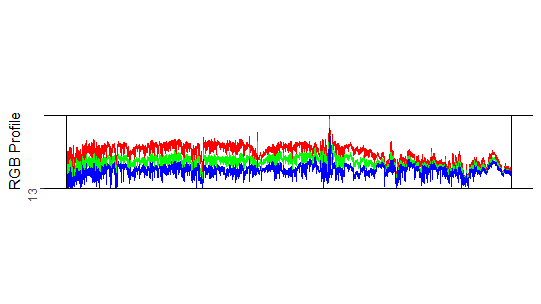
This topic was automatically closed 21 days after the last reply. New replies are no longer allowed.

If you have a query related to it or one of the replies, start a new topic and refer back with a link.