Hello there,
I´m programming a code to plot some point of a dataset, and I get the length error, dont know why and how to fix it, is a "for" loop and here is the code:
for (i in Data) {
    if (proveedor == 1) {plot(coorx[i], coory[i], col = "yellow")} else
    if (proveedor == 2) {plot(coorx[i],coory[i], col = "red")} else
    if (proveedor == 3) {plot(coorx[i],coory[i], col="green")}else
    if (proveedor == 4){plot(coorx[i], coory[i], col = "blue")} else
    if (proveedor == 5) {plot(coorx[i], coory[i], col = "violet")}else
    if (proveedor == 6) {plot(coorx[i], coory[i], col = "grey")} else NULL
}
#> Error in eval(expr, envir, enclos): object 'Data' not found
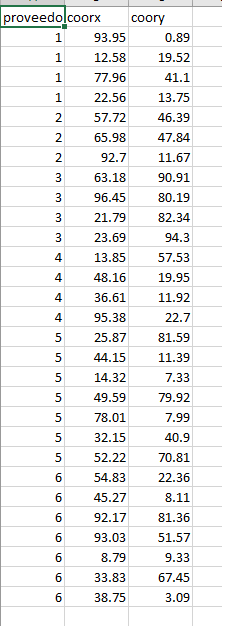
I also attach an image of my data, so the code gets more contextualized, I'm pretty new in this language so I would be son thankful if u can answer me, THANKS!
The error says there's no object called Data in the R environment.
Assuming you've loaded your data into R and the data frame is called Data, then the code for the loop would be for (i in 1:nrow(Data)) {. The loop is supposed to go through each row of the data, so the loop variable i should go from 1 to the number of rows in the data.
You would also need to provide the data frame name for the plot command (e.g., plot(Data$coorx[i], Data$coory[i], col="yellow")), but (as raytong shows below) you should run plot only once and use points to add the points. In any case, a more efficient approach would be something like this (using the built-in mtcars data frame for the example):
# Set the color palette
palette(c("yellow", "red", "green"))

d = mtcars
plot(d$mpg, d$hp, col=d$cyl)
Hi @Spectral. You can use ggplot to do your plot easier. But if you want to code it with for loop. Try the following.
Your code cannot be run because the for (i in Data) will just loop each column, not row. And the you call the column name cannot get the values inside. The if else statement use plot will refresh all plot and cannot plot on each others. So, for your code, I suggest use with to construct the environment with the column as variable. And start an empty plot with plot. Overlay point will points.
``` r
Data <- data.frame(proveedor = rep(1:5, 3),
coorx = rnorm(15),
coory = rnorm(15))
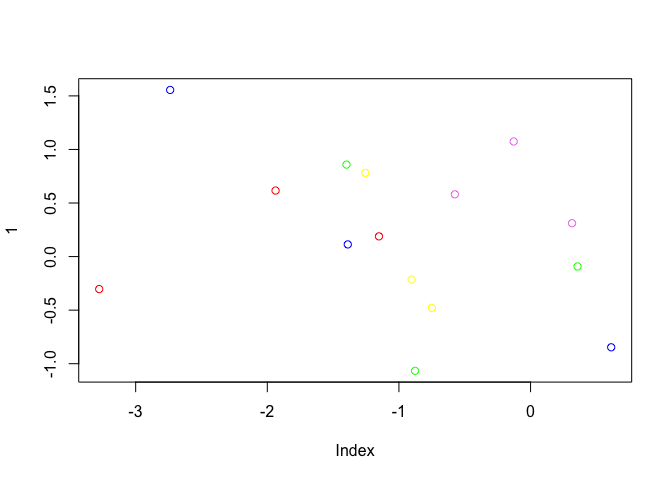
with(Data, {
plot(1, type = "n", xlim = range(Data$coorx), ylim = range(Data$coory))
for (i in 1:nrow(Data)) {
if (proveedor[i] == 1) {points(coorx[i], coory[i], col = "yellow")} else
if (proveedor[i] == 2) {points(coorx[i],coory[i], col = "red")} else
if (proveedor[i] == 3) {points(coorx[i],coory[i], col="green")}else
if (proveedor[i] == 4){points(coorx[i], coory[i], col = "blue")} else
if (proveedor[i] == 5) {points(coorx[i], coory[i], col = "violet")}else
if (proveedor[i] == 6) {points(coorx[i], coory[i], col = "grey")} else NULL
}})
Can u explain me what are u doing? I´m from Chile so if u can keep the explanation simple (in terms of english) and also don´t understand what is "with" function doing, but that's on me, by the way thank u!
Thank u, I'll get more info about ggplot2 and apply it in another time, really thanks, but by now is more usefull the answer wich is more similary to my code, THANKS AGAIN!