I'd like to use time series clustering using the dtwclust package. The problem is the conversion of my data.frame to list of time series. All my blocks ID (named STAND) has 180 days in negative values (DATE_TIME) The B2_MAX is my variable response. In my example:
    library(dplyr)
    library(ggplot2)
    library(dtwclust)

    all.B2_MAX.stands <- read.csv("https://raw.githubusercontent.com/Leprechault/trash/main/my_ts_data.csv")

    all.B2_MAX.tsc <-  all.B2_MAX %>%
      group_by(STAND) %>%
      summarise(var = list(B2_MAX[order(DATE_TIME)]),
                var_ts = purrr::map(var, ts))

    clusters <- tsclust(all.B2_MAX.tsc[-1],
                       type="partitional",
                       k=2L,
                       distance="dtw",
                       centroid = "pam")

    #plot
    plot(cluster, type = "sc")

    #Error in lapply(series, base::as.numeric) :
    #  'list' object cannot be coerced to type 'double'
If the problem is the negative values and the actual values aren't important, but the order is, you could add 180 to the DATE_TIME column. So -180 would be 0 and so on.
library(dtwclust)
#> Loading required package: proxy
#>
#> Attaching package: 'proxy'
#> The following objects are masked from 'package:stats':
#>
#> as.dist, dist
#> The following object is masked from 'package:base':
#>
#> as.matrix
#> Loading required package: dtw
#> Loaded dtw v1.23-1. See ?dtw for help, citation("dtw") for use in publication.
#> dtwclust:
#> Setting random number generator to L'Ecuyer-CMRG (see RNGkind()).
#> To read the included vignettes type: browseVignettes("dtwclust").
#> See news(package = "dtwclust") after package updates.
d <- read.csv("https://raw.githubusercontent.com/Leprechault/trash/main/my_ts_data.csv")
l <- split(d$B2_MAX,d$STAND)
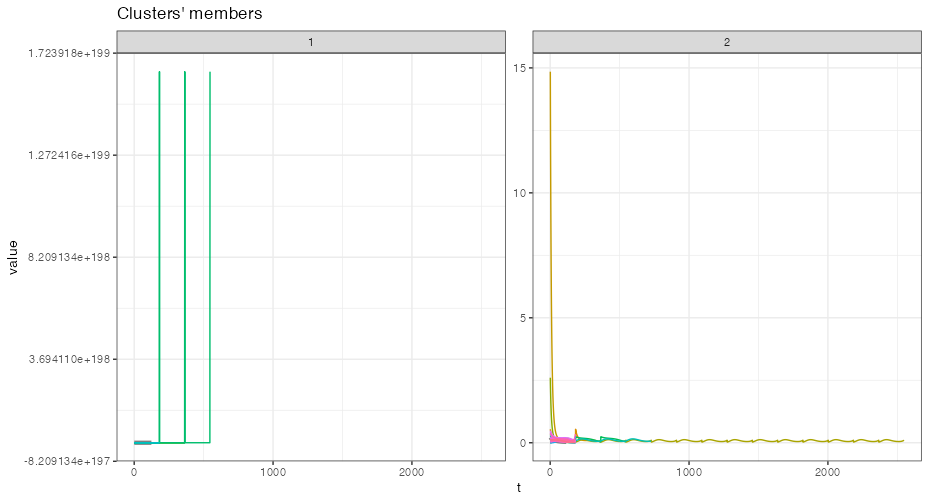
o <- tsclust(l,
type="partitional",
k=2L,
distance="dtw_basic",
centroid = "pam")
plot(o)