Hi,
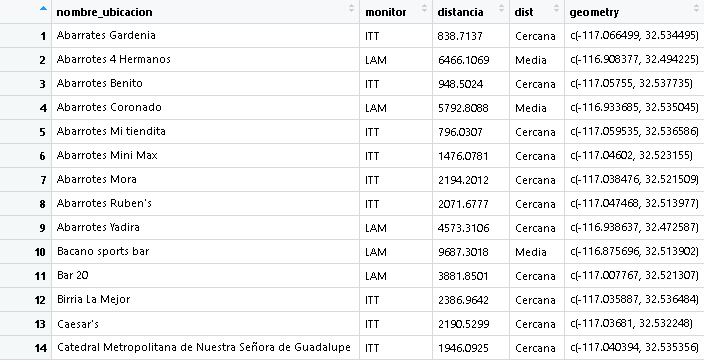
i want to color each point according to the category it belongs to, i have 2 categories = "cercana" and "media" as you can see in the dist column
i try this, but it doesnt color the 2 categories
ggplot()+
  geom_sf(data = tij_mun, fill = 'transparent') +
  geom_sf(data= tij_mon, col = "green", size=1.5) +
  geom_sf(data = tij_vial, colour = "grey", size = 0.5, alpha = 0.4) +
  geom_sf(data= dist_direcmon, aes(geometry = geometry, col= "dist"), size =0.7) +
    scale_shape_manual(values = c("solid", "solid")) +
    scale_colour_manual(values = c('red', 'blue')) +
  labs(title = "Tijuana, Baja California",
       subtitle = "Distancia entre ubicaciones seleccionadas y su monitor más cercano",
       y="Latitud",
       x="Longitud")

ggplot()+
  geom_sf(data = tij_mun, fill = 'transparent') +
  geom_sf(data = tij_mon, col = "green", size=1.5) +
  geom_sf(data = tij_vial, colour = "grey", size = 0.5, alpha = 0.4) +
  geom_sf(data = dist_direcmon, aes(geometry = geometry, col= "dist", fill ="dist"), size =0.7)+
  scale_color_viridis(discrete = T, name= "Distancia (metros)")+
  labs(title = "Tijuana, Baja California",
       subtitle = "Distancia entre ubicaciones seleccionadas y su monitor más cercano",
       y="Latitud",
       x="Longitud")