Probability options to recommend

Hello,

About this:

  df <- data.frame(client = c("1a", "1a", "2b", "2b", "3c", "3c", "4d",  "4c", "4c"),
                      sku = c(1, 2, 3, 4, 3, 2, 1, 1, 2),
                frequency = c(4,3,2,1,2,2,4,5,5))

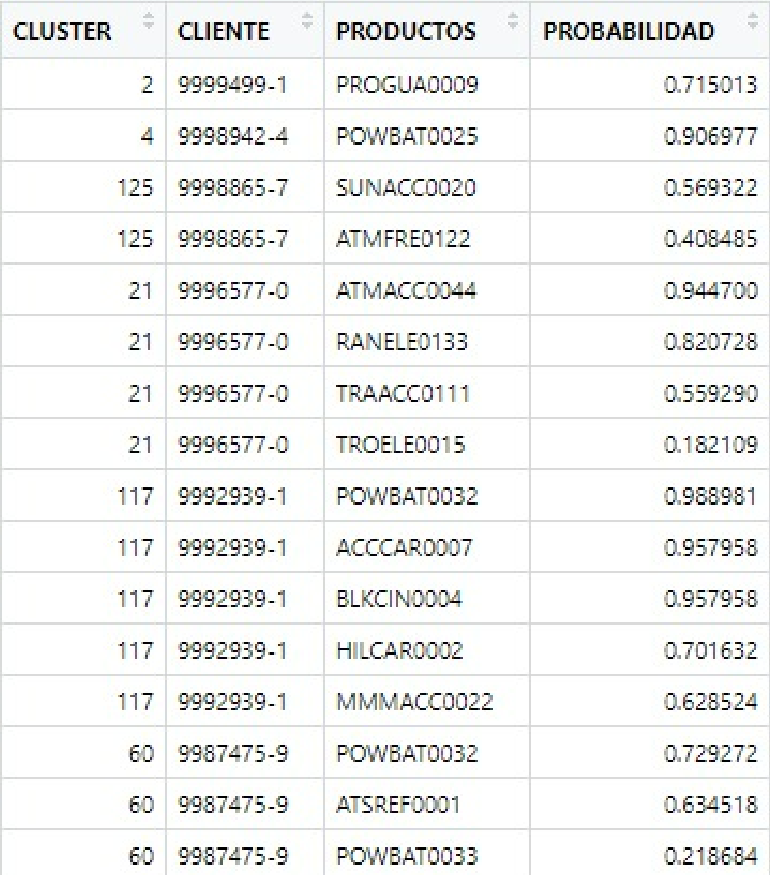
How can I obtain the probability of buy? like:

  client sku frequency prob
1     1a   1         4 x
2     1a   2         3 x
3     2b   3         2 x
4     2b   4         1 x
5     3c   3         2 x
6     3c   2         2 x
7     4d   1         4 x
8     4c   1         5 x
9     4c   2         5 x

I tried with this link
But I can´t find a professional answer that can help me to order the maximum to the minimum probability of buy and give an appropiate recommendation, in this case is through frecuency, but I don´t know if must have more variables the df

Thanks!

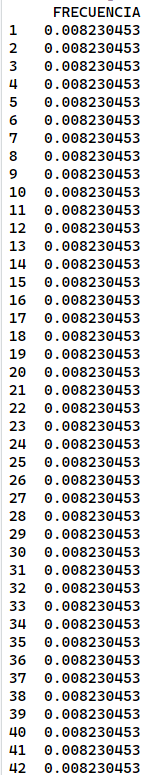
For example, I think that I must count a variable or use a similar function as count().... something like this:
df %>% count() %>% mutate(prob = n/sum(n))

or do a prediction vector and add a mutate() to the df and arrange like...
arrange(desc(prediction))

I still can not obtain a solution.
I hope you can help me, thank you!
or any link!

This problem illustrates the critical importance of framing the question that a statistical test is supposed to answer.

The data consists of a combination of client and stock keeping unit (sku) identifier, which are both categorical data types and the associated frequency, which is an integer count. If the data frame is actually representative of data that represents observations over some period. If the question is

What will be the frequency of each combination of client and sku in the next period, assuming no new clients and no new sku?

To that possible answers include:

  • It will be the same (different by zero)
  • It will be different by some constant amount
  • It will be different by some random amount
  • It will be different by some amount determined by divination

The data only provides the base amount from which change will be calculated, but can provide no help in choosing among them. There is no variance.

What is the specific question that you have in mind for this dataset?

Hi,
Thank you very much.
I need some example that permits to obtain this output:
For example the 9996577-0 has four productsSKU that has a desc probability of buy:

0.944
0.820
0.559
0.182

But I don´t know how the actual company obtained the probability of buy a these product by rut or id.
I don´t know what formula it´s correct or could be the appropiate to obtain that mutate variable, I tried:

What will be the frequency of each combination of client and sku in the next period, assuming no new clients and no new sku? I suppose that if it has a frequency I could obtain the probability.

              mutate(prob = scales::percent(sum(FRECUENCIA) / length(FRECUENCIA))) %>%
              mutate(prob = n/sum(n)) %>% 
              arrange(CLIENTE, prob)

But it does´n work.
I don´t know how can I obtain the probability...

  df <- data.frame(id = c("1-1","1-1","1-1","1-1","1-1","1-1","1-1","1-1",
                            "1-1","1-1", "1-1","1-1","1-1","1-1","1-1",
                            "2-2","2-2","2-2","2-2","2-2"),
                     group = c(1,1,1,2,2,3,3,3,4,4,5,
                               5,5,5,5,
                               5,5,5,7,8),
                     product = c(1,2,3,4,5,6,7,8,9,10,11,12,13,14,
                                 15,16,17, 18, 19, 20),
                     client = c("90-1", "90-1","90-1","90-1","90-1","90-1","90-1",
                              "90-1","90-1","90-1","90-1","90-1","90-2","90-2",
                              "90-2","90-2","90-2","90-3","90-3","90-3"),
                     freq = c(2,2,2,4,5,6,1,1,2,8,11,1,3,4,
                                 5,6,1, 3, 7, 6)) %>% 
                    mutate(prob = 1/freq)

I tried that, and I haven´t obtained yet a solution as the picture

With these data the only way to derive something like a probability is to consider the two clients and the freq variable as the number of purchases of each item. For example, client 90-1 purchased 12 different products classified into 5 groups for a total of 45 items, so the proportions would be

d[d$client == "90-1",][5]/d[d$client == "90-1",][5] |> sum()
         freq
1  0.04444444
2  0.04444444
3  0.04444444
4  0.08888889
5  0.11111111
6  0.13333333
7  0.02222222
8  0.02222222
9  0.04444444
10 0.17777778
11 0.24444444
12 0.02222222

Those proportions aren't really probabilities, though. They are just descriptive of history.

1 Like

Hi Richard,

Thank you for the time, I really appreciate it.
I applied your code in my real data and this is the output:

Not the result that I hope.
But because you help me and gave me a positive idea, I mark this as a solution.
Anyway I sent you a message with a real data sample.

Thanks!

I´m trying this code too: link

  df$prob <- prop.table(df$freq)
  # En porcentajes con dos decimales:
  df$prob <- round(prop.table(df$freq), 4)*100

The real data has others variables, that I don´t consider in this post... I´ll try to think in these others variables and try to insert your idea and different options that I´ve been looking.
Anyway thank you for the tip and the time, I´m going to study your idea and try to get a probability similar to the first picture. Your comments and your code, gave me an idea how to resolve the problem and get an approach.

Thank you Richard (y)

1 Like

This topic was automatically closed 7 days after the last reply. New replies are no longer allowed.

If you have a query related to it or one of the replies, start a new topic and refer back with a link.