Hello,
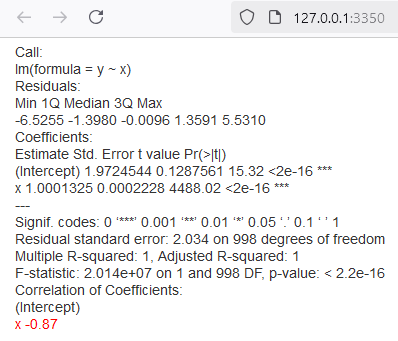
I'm trying to customize the summary output of a lm() fit on my shiny app to add color to the correlation values shown on the UI.
My guess is that this should be done with html/css tags.
So I have taken the print.summary.lm function to add in some html to the correlation matrix near the end when printing correlations.
I have renamed this function as customPrint in the script below.
My problem is that I'm not able to get the html tag to work.
I'm using renderPrint, but also tested with renderText and renderUI.
I have also tried with the HTML() function around the modified correlation matrix.
Any help is appreciated, even an informed "this is not possible".
library(shiny)

options(shiny.autoreload = T)

ui <- fluidPage(
  # textOutput("summary")
  # htmlOutput("summary")
  verbatimTextOutput(outputId = "summary", placeholder = F)
)

server <- function(input, output) {

  # output$summary <- renderText({
  # output$summary <- renderUI({
  output$summary <- renderPrint({
    n <- 1000
    x <- seq(n)
    y <- x + rnorm(n = n, mean = 2, sd = 2)
    fit <- lm(y ~ x)
    customPrint(summary.lm(object = fit, correlation = T))
  })

  customPrint <- function(x, digits = max(3L, getOption("digits") - 3L), symbolic.cor = x$symbolic.cor, signif.stars = getOption("show.signif.stars"), ...) {
    cat("\nCall:", "\n", paste(deparse(x$call), sep = "\n", collapse = "\n"), "\n\n", sep = "")
    resid <- x$residuals
    df <- x$df
    rdf <- df[2L]
    cat(if (!is.null(x$weights) && diff(range(x$weights))) "Weighted ", "Residuals:\n", sep = "")
    if (rdf > 5L) {
      nam <- c("Min", "1Q", "Median", "3Q", "Max")
      rq <- if (length(dim(resid)) == 2L)
        structure(apply(t(resid), 1L, quantile), dimnames = list(nam,
                                                                 dimnames(resid)[[2L]]))
      else {
        zz <- zapsmall(quantile(resid), digits + 1L)
        structure(zz, names = nam)
      }
      print(rq, digits = digits, ...)
    } else if (rdf > 0L) {
      print(resid, digits = digits, ...)
    } else {
      cat("ALL", df[1L], "residuals are 0: no residual degrees of freedom!")
      cat("\n")
    }
    if (length(x$aliased) == 0L) {
      cat("\nNo Coefficients\n")
    } else {
      if (nsingular <- df[3L] - df[1L]) {
        cat("\nCoefficients: (", nsingular, " not defined because of singularities)\n", sep = "")
      } else {
        cat("\n")
        cat("Coefficients:\n")
      }
      coefs <- x$coefficients
      if (!is.null(aliased <- x$aliased) && any(aliased)) {
        cn <- names(aliased)
        coefs <- matrix(NA, length(aliased), 4, dimnames = list(cn, colnames(coefs)))
        coefs[!aliased, ] <- x$coefficients
      }
      printCoefmat(coefs, digits = digits, signif.stars = signif.stars, signif.legend = T, na.print = "NA", eps.Pvalue = .Machine$double.eps, ...)
    }
    cat("\nResidual standard error:", format(signif(x$sigma, digits)), "on", rdf, "degrees of freedom")
    cat("\n")
    if (nzchar(mess <- naprint(x$na.action))) {
      cat("  (", mess, ")\n", sep = "")
    }
    if (!is.null(x$fstatistic)) {
      cat("Multiple R-squared: ", formatC(x$r.squared, digits = digits))
      cat(",\tAdjusted R-squared: ", formatC(x$adj.r.squared, digits = digits),
          "\nF-statistic:", formatC(x$fstatistic[1L], digits = digits),
          "on", x$fstatistic[2L],
          "and", x$fstatistic[3L],
          "DF,  p-value:", format.pval(pf(x$fstatistic[1L], x$fstatistic[2L], x$fstatistic[3L], lower.tail = FALSE), digits = digits, .Machine$double.eps))
      cat("\n")
    }
    correl <- x$correlation
    if (!is.null(correl)) {
      p <- NCOL(correl)
      if (p > 1L) {
        cat("\nCorrelation of Coefficients:\n")
        if (is.logical(symbolic.cor) && symbolic.cor) {
          print(symnum(correl, abbr.colnames = NULL))
        } else {
          correl <- format(round(correl, 2), nsmall = 2, digits = digits)
          # Adding correlation colors here
          correlColor <- apply(correl, c(1, 2), function(x) {
            if (abs(as.numeric(x)) > 0.9) {
              sprintf('<span style="color: red;">%s</span>', x)
            } else {
              sprintf('<span style="color: green;">%s</span>', x)
            }
          })
          correl[!lower.tri(correl)] <- ""
          # print(HTML(correlColor[-1, -p, drop = F]), quote = F)
          print(correlColor[-1, -p, drop = F], quote = F)
        }
      }
    }
    cat("\n")
    invisible(x)
  }

}

shinyApp(ui = ui, server = server)