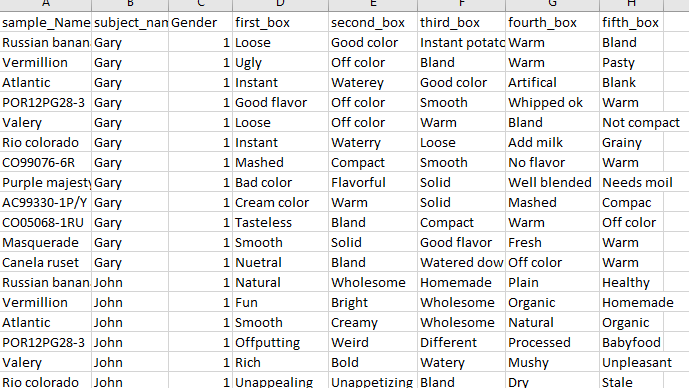
Hello, I was wondering if someone can help me prepare contingency table. I wish to have 'sample_name' in rows and words used in rows from first to fifth answer box in column. data file added here.
Here is code:
library(tidyverse)

# create a similar data frame for demonstration
df <- tibble(
  sample_name = c("tom", "john"),
  first_box = c("loose", "ugly"),
  second_box = c("good color", "off color")
)

df
#> # A tibble: 2 x 3
#>   sample_name first_box second_box
#>   <chr>       <chr>     <chr>
#> 1 tom         loose     good color
#> 2 john        ugly      off color

# should include 5 columns in pivot_longer for your data
df %>%
  pivot_longer(c(first_box, second_box), names_to = "box", values_to = "word") %>%
  xtabs(~ sample_name + word, data = .)
#>            word
#> sample_name good color loose off color ugly
#>        john          0     0         1    1
#>        tom           1     1         0    0
@enixam No, I was asking if I can make a table of it and see if df (data frame) in a table format. Currently, i was only able to see it in a console. What code I should use?
Do you mean a formatted table in a report? If you know how to use R Markdown then just pipe the resulting data frame to knitr::kable(), after knitting you get what you want.
I am not sure if I know markdown. I want to see it a table, like shown in image. And if I can make excel table of it so that I can manually work on it for duplicated words (I mean like people may wrote aroma, odor, smell as a separate but they actually mean similar, so I want to club them under one label).
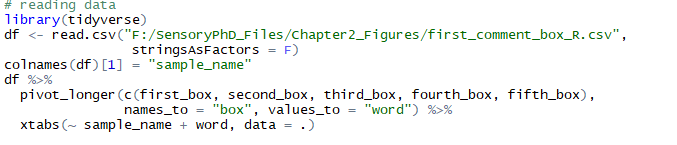
# reading data
library(tidyverse)
#> Warning: package 'tidyverse' was built under R version 3.5.3
#> Warning: package 'ggplot2' was built under R version 3.5.3
#> Warning: package 'tibble' was built under R version 3.5.3
#> Warning: package 'tidyr' was built under R version 3.5.3
#> Warning: package 'purrr' was built under R version 3.5.3
#> Warning: package 'dplyr' was built under R version 3.5.3
#> Warning: package 'stringr' was built under R version 3.5.3
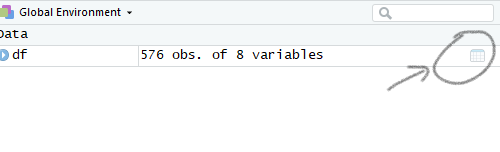
df <- read.csv("F:/Sensory/Ch2_Figures/first_comment_box_R.csv",
stringsAsFactors = F)
colnames(df)[1] = "sample_name"
# Prepared table
df %>%
pivot_longer(c(first_box, second_box, third_box, fourth_box, fifth_box),
names_to = "box", values_to = "word") %>%
xtabs(~ sample_name + word, data = .)
#> word
#> sample_name "By hand" texture A bit chunky A bit dry
#> AC99330-1P/Y 0 0 0
#> Atlantic 0 0 0
#> Canela ruset 0 1 0
#> CO05068-1RU 1 0 0
#> CO99076-6R 0 0 0
#> Masquerade 0 0 0
#> POR12PG28-3 0 0 0
#> Purple majesty 0 0 0
#> Rio colorado 0 0 0
#> Russian banana 0 0 1
#> Valery 0 0 0
#> Vermillion 0 0 0
knitr::kable(df, row.names = T, col.names = T)
#> Error in dimnames(x) <- dn: length of 'dimnames' [2] not equal to array extent