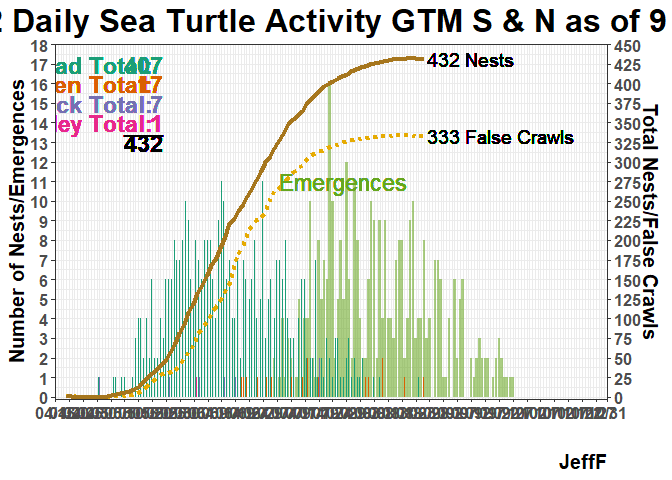
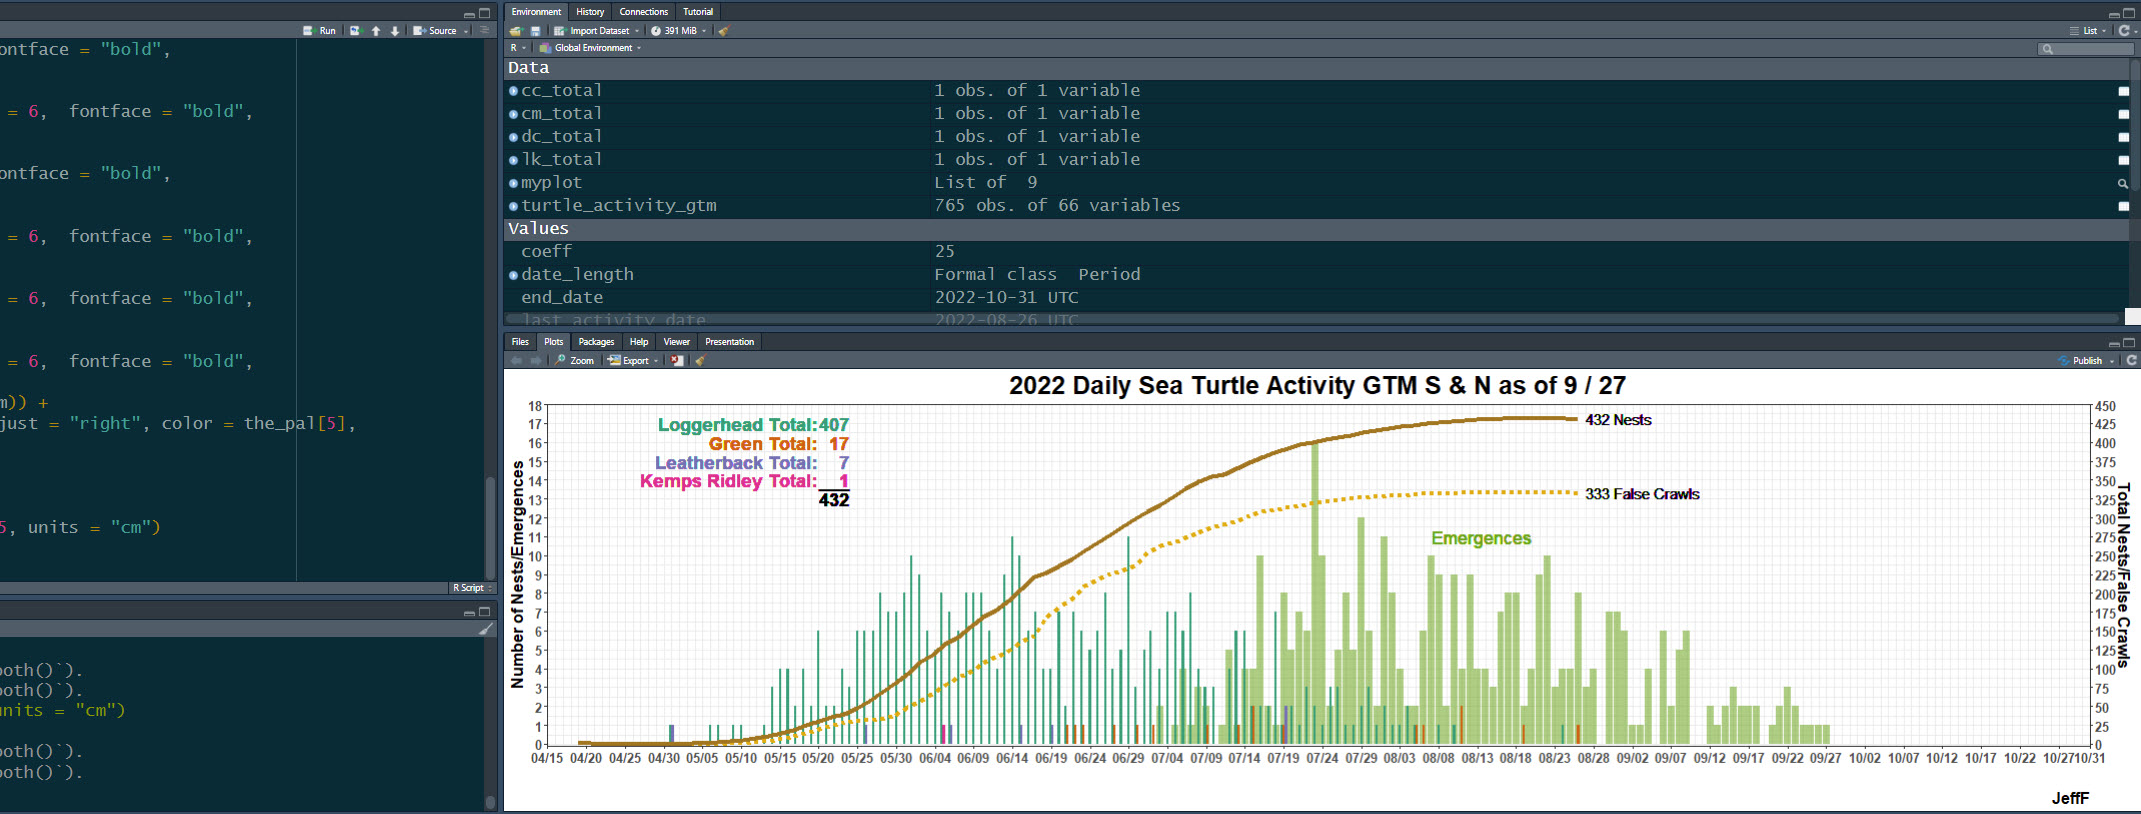
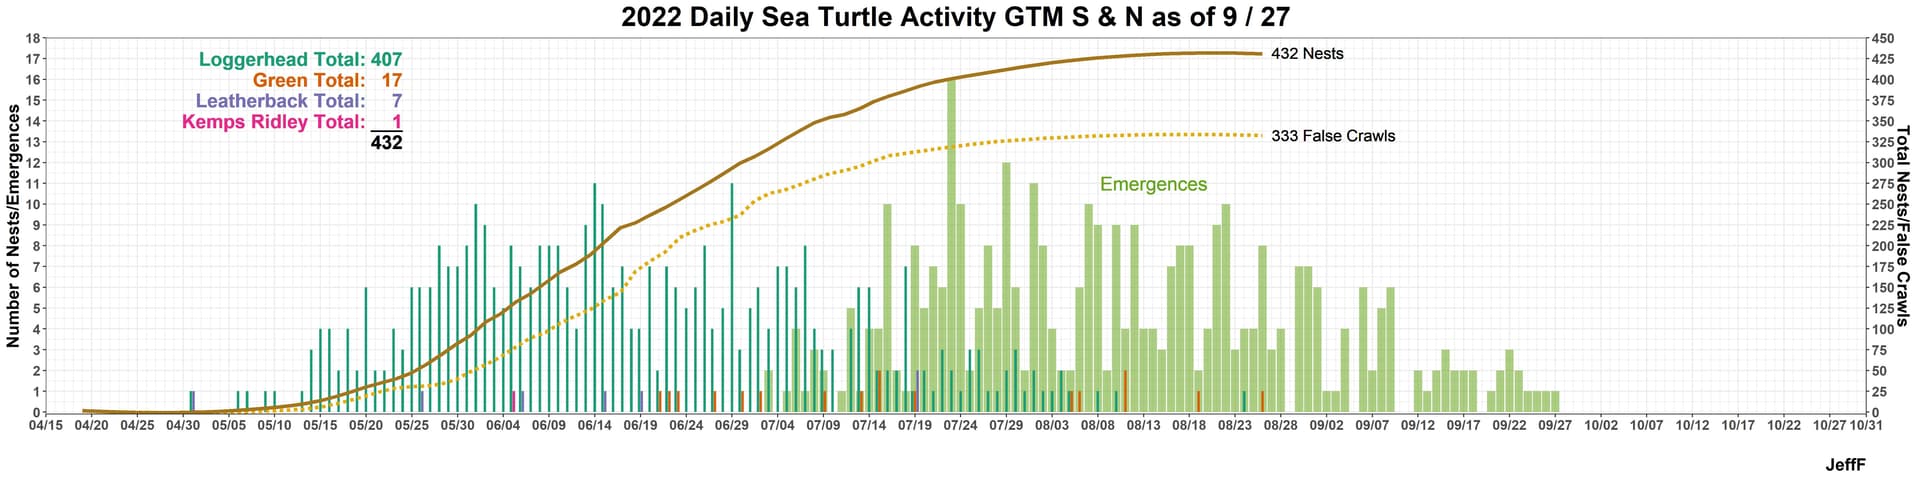
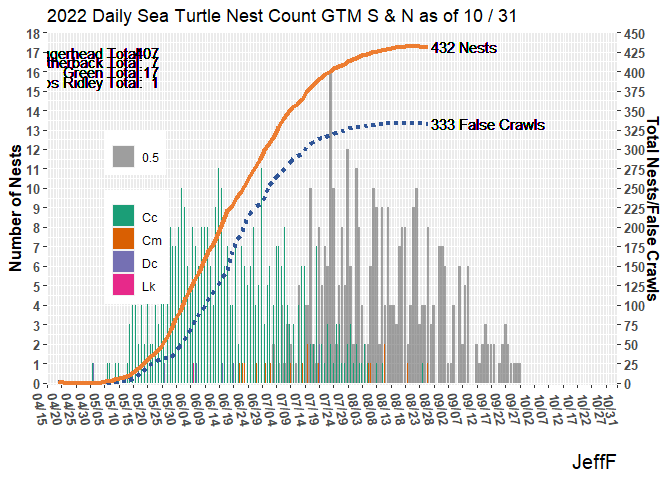
I’ve been hunting around for a way to do this, if even possible. In the plot below is there a way the geom_text annotations such as Loggerhead Total: 407 matches the color for “Cc” which is part of “species” used to specify fill color for the bar plots..
Thanks,
Jeff
library(tidyverse)
library("lubridate")
#> Loading required package: timechange
#>
#> Attaching package: 'lubridate'
#> The following objects are masked from 'package:base':
#>
#>     date, intersect, setdiff, union
library("RColorBrewer")
library("reprex")
start_date <- ymd("2022-04-15")
end_date <- ymd("2022-10-31")
position_date <- ymd("2022-05-05") #place on x-axis
last_report_date <- ymd("2022-10-31")

date_length <-days(start_date %--% end_date )
position_date_len <- days(start_date %--% position_date)
relative_date <- position_date_len/date_length
rel_y <- 13/18
coeff <- 25
turtle_activity_gtm <-  read_csv("https://www.dropbox.com/s/7ubvhajvkhx53kc/mpt_act_rep_cum_fc_cum_nest.csv?dl=1")
#> Rows: 765 Columns: 66
#> ── Column specification ────────────────────────────────────────────────────────
#> Delimiter: ","
#> chr  (22): beach, county, activity, ref_no, activity_comments, encountered?,...
#> dbl  (35): uid, activity_no, fcrawl, fcrawl_cum, clutch, clutch_cum, nest_no...
#> lgl   (6): final_treatment, light_management, relocation_reason, lost_nest, ...
#> date  (3): activity_date, emerge_date, inventory_date
#>
#> ℹ Use `spec()` to retrieve the full column specification for this data.
#> ℹ Specify the column types or set `show_col_types = FALSE` to quiet this message.
#Above file has cumulative false crawls and cumulative nests added along with proper date format.
cc_total <- count(turtle_activity_gtm |> filter(activity=="N") |> filter(species =='Cc'))
dc_total <- count(turtle_activity_gtm |> filter(activity=="N") |> filter(species =='Dc'))
cm_total <- count(turtle_activity_gtm |> filter(activity=="N") |> filter(species =='Cm'))
lk_total <- count(turtle_activity_gtm |> filter(activity=="N") |> filter(species =='Lk'))
#suppressWarnings(print(
ggplot(data = (turtle_activity_gtm |> filter(activity=="N"))) +
  scale_fill_brewer(palette = "Dark2") +
  scale_color_brewer(palette = "Dark2") +
  geom_bar(aes(x = emerge_date, alpha=.5),
           na.rm = TRUE,
           position = position_dodge2(preserve = "total")) +
  geom_bar(aes(x = activity_date, fill = species),
           na.rm = TRUE,
           position = position_dodge2(preserve = "single")) +
  scale_y_continuous(breaks = 0:18, expand = c(0,0),
                     sec.axis = sec_axis(~.*coeff, name="Total Nests/False Crawls",
                                         breaks = seq(0,450,25))) +
  expand_limits(y = c(-.1, 18)) +
  scale_x_date(breaks = c(seq.Date((start_date), (end_date),
                                   by = '5 days'), end_date),
               date_labels = "%m/%d",
               date_minor_breaks = "1 day",
               limits = c( start_date, end_date),
               expand = c(0,0))   +
  labs(x="",y="Number of Nests", title=paste("2022 Daily Sea Turtle Nest Count GTM S & N as of",month(last_report_date),"/",mday(last_report_date)),
       caption='JeffF') +
  theme(axis.text.y = element_text(face = "bold",
                                   size = 10, angle = 0),
        axis.text.x = element_text(face = "bold",
                                   size = 10, angle = -80),
        legend.position=c(x=relative_date, y=rel_y),
        legend.justification = c(0, 1), #upper left
        legend.title = element_blank(),
        axis.title = element_text(size = 12, face = "bold"),
        plot.caption = element_text(size = 15)) +
  #theme(legend.position = "none") +
  geom_smooth(data = turtle_activity_gtm, method = 'loess', formula = 'y ~ x',
              aes(x=activity_date, y=fcrawl_cum/coeff),linetype = "111111",
              linewidth = 1.5, color = '#2F5597',  span = 0.08, se = FALSE) +
  geom_smooth(data = turtle_activity_gtm, method = 'loess', formula = 'y ~ x',
              aes(x=activity_date, y=clutch_cum/coeff), linewidth = 1.5,
              color ='#ED7D31', span = 0.08, se = FALSE)  +
  geom_text(x=ymd(max(turtle_activity_gtm$activity_date+1,na.rm = TRUE)),
            y=18*(max(turtle_activity_gtm$fcrawl_cum/450)),
            hjust = "left",label=paste(max(turtle_activity_gtm$fcrawl_cum),
                                       'False Crawls'  )) +
  geom_text(x=ymd(max(turtle_activity_gtm$activity_date+1,na.rm = TRUE)),
            y=18*(max(turtle_activity_gtm$clutch_cum/450)),
            hjust = "left",label=paste(max(turtle_activity_gtm$clutch_cum),
                                       'Nests')) +
  geom_text(x=ymd("2022-05-20"), y=17,  hjust = "right",
            label=paste("Loggerhead Total: ")) +
  geom_text(x=ymd("2022-05-20")+days(4), y=17,  hjust = "right",
            label=paste(cc_total)) +
  geom_text(x=ymd("2022-05-20"), y=16.5,  hjust = "right",
            label=paste("Leatherback Total: ")) +
  geom_text(x=ymd("2022-05-20")+days(4), y=16.5,  hjust = "right",
            label=paste(dc_total)) +
  geom_text(x=ymd("2022-05-20"), y=16,  hjust = "right",
            label=paste("Green Total: ")) +
  geom_text(x=ymd("2022-05-20")+days(4), y=16,  hjust = "right",
            label=paste(cm_total)) +
  geom_text(x=ymd("2022-05-20"), y=15.5,  hjust = "right",
            label=paste("Kemps Ridley Total: ")) +
  geom_text(x=ymd("2022-05-20")+days(4), y=15.5,  hjust = "right",
            label=paste(lk_total))
#> Warning: Removed 1 rows containing non-finite values (`stat_smooth()`).
#> Removed 1 rows containing non-finite values (`stat_smooth()`).
Created on 2023-01-18 with reprex v2.0.2