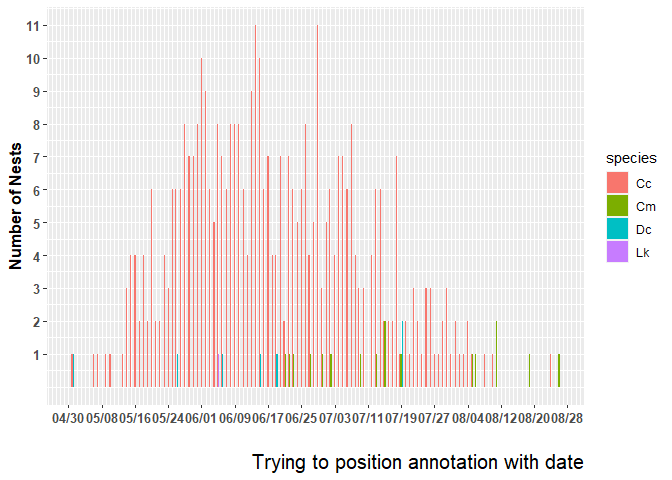
I cannot seem to position text or legend on a plot with dates as the x-axis. If I try the legend placement, the plot is blank. What do I need to do in this plot?
Thanks,
Jeff
library(tidyverse)
library("reprex")
turtle_activity_gtm_nest_date <- read_csv("https://www.dropbox.com/s/nkqtfvtug46r4w6/turtle_activity_report_nest_date.csv?dl=1")
#> Rows: 765 Columns: 6
#> ── Column specification ────────────────────────────────────────────────────────
#> Delimiter: ","
#> chr (4): activity, ref_no, activity_date, species
#> dbl (2): latitude, longitude
#>
#> ℹ Use `spec()` to retrieve the full column specification for this data.
#> ℹ Specify the column types or set `show_col_types = FALSE` to quiet this message.
turtle_activity_gtm_nest_date$activity_nest_date <-
as.Date(turtle_activity_gtm_nest_date$activity_date,format="%m/%d/%Y")
#Ignore first nest with odd-ball date for the moment and remove NA.
turtle_activity_gtm_nest_date <- drop_na(turtle_activity_gtm_nest_date)
turtle_activity_gtm_only_nest_date <- turtle_activity_gtm_nest_date |> filter(activity=="N")
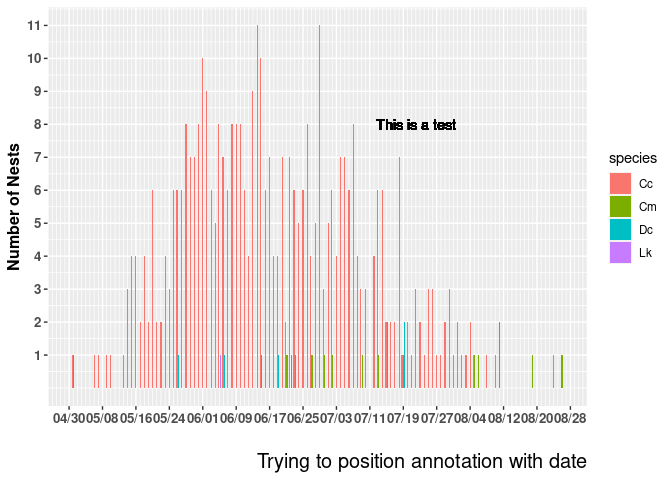
ggplot() +
geom_bar(data = turtle_activity_gtm_only_nest_date|>
mutate(
activity_date = lubridate::mdy(activity_date)
),
aes(x = activity_date, fill = species),
#width = 0.1,
position = position_dodge2(preserve = "single")) +
scale_x_date(date_breaks = "8 day",
date_labels = "%m/%d",
date_minor_breaks = "1 day") +
scale_y_continuous(breaks = 1:12) +
labs(x="",y="Number of Nests", caption='Trying to position annotation with date') +
theme(axis.text.y = element_text(face = "bold",
size = 10, angle = 0),
axis.text.x = element_text(face = "bold",
size = 10, angle = 0),
# legend.position=c(as.Date("2022-07-22"), 0),
axis.title = element_text(size = 12, face = "bold"),
plot.caption = element_text(size = 15)) +
geom_text(x=as.Date("2022-07-22"), y=8, label="This is a test")
Created on 2023-01-06 with reprex v2.0.2