positioning legend when using plot.title.position="plot"

Hello,

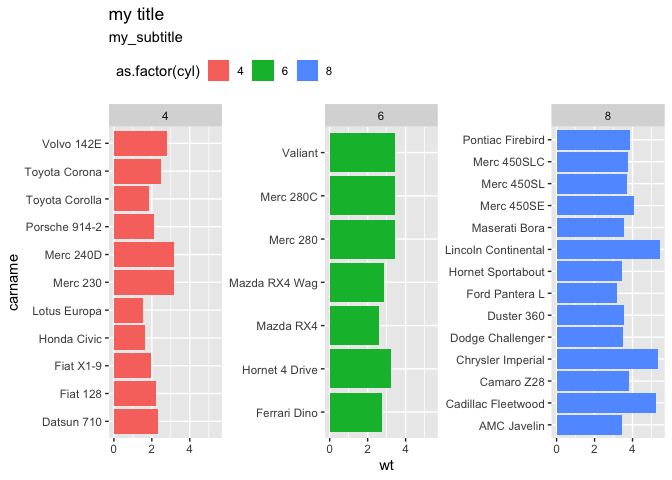
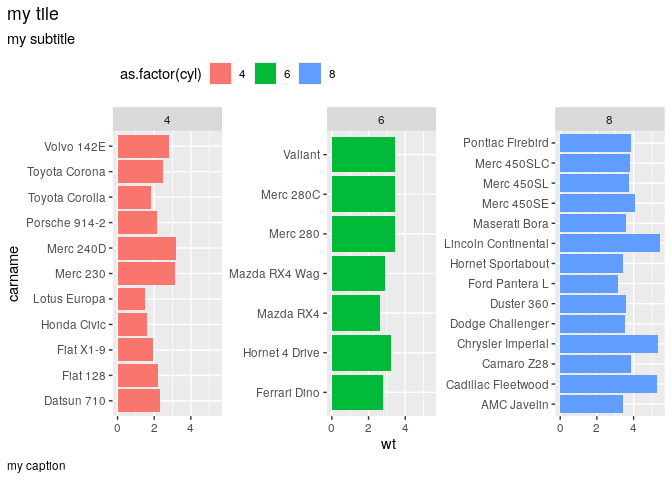
recently a new theme argument was introduced into ggplot which allows to align the title, subtitle and caption with the plot's (and not the panels) outer margin: plot.title.position="plot" etc.

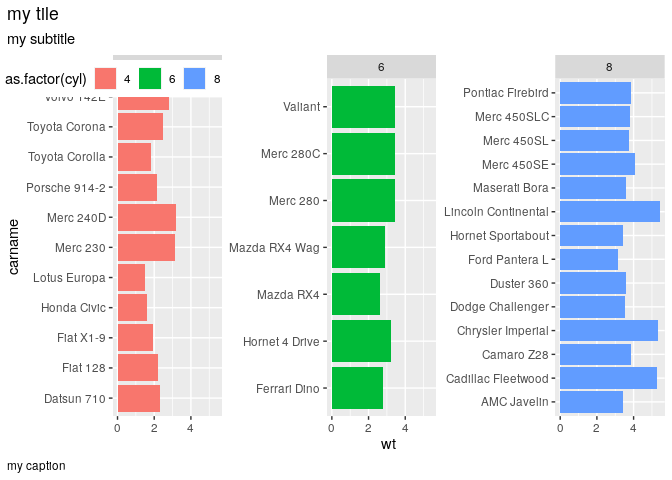
Is there any way how to move also the legend to e.g. the very left (as in my example below)? Many thanks!

library(tidyverse)

mtcars %>% 
  rownames_to_column(., var="carname") %>% 
  ggplot()+
  labs(title="my tile",
       subtitle="my subtitle",
       caption="my caption")+
  geom_bar(aes(x=carname,
               y=wt,
               fill=as.factor(cyl)),
           stat="identity")+
  coord_flip()+
  facet_wrap(vars(cyl),
             scales="free_y")+
  theme(legend.position = "top",
        legend.justification = "left",
        plot.title.position = "plot",
        plot.caption = element_text(hjust=0),
        plot.caption.position = "plot")

Created on 2020-01-15 by the reprex package (v0.3.0)

2 Likes

This gets you almost there

suppressPackageStartupMessages(library(dplyr))
suppressPackageStartupMessages(library(ggplot2)) 
mtcars_tib <- mtcars %>% tibble::rownames_to_column(., var="carname")
# base plot
p <- ggplot(mtcars_tib) + 
    geom_bar(aes(x=carname, y=wt, fill=as.factor(cyl)), stat="identity") +
    coord_flip() +
    facet_wrap(vars(cyl), scales="free_y")
p <- p + ggtitle("my title", subtitle = "my_subtitle")
p + theme(legend.position = "top", legend.justification = "left")  

Created on 2020-01-15 by the reprex package (v0.3.0)

1 Like

Many thanks, but it seems I was not clear enough with my question. I want to move the legend to the left, not the title and subtitle to the right.

1 Like

The most difficult part of R is finding the right question, and here is no exception. And, it also demonstrates the importance of reprex. The code originally posted throws an error

Error in (function (el, elname) :
"plot.title.position" is not a valid theme element name.

and it doesn't produce the screenshot, which now looks like something edited outside ggplot.

So, let's go back to the point where we have the plot in the viewport as shown in my answer, and think about what you are trying to do in terms of how to get from there to the point where you're moving the title, subtitle and legend out of the viewport (sort of like typing in the margins in word processing).

Can you post a reprex to show how you're trying to plot anything outside the viewport?

The OP hasn't said it explicitly but you can infer from the context that it is using the development version of ggplot2 so it actually is a reprex and it does produce the shown output, so for your peace of mind, here is the reprex created with reprex package to prove it

library(tidyverse)

mtcars %>% 
    rownames_to_column(., var="carname") %>% 
    ggplot()+
    labs(title="my tile",
         subtitle="my subtitle",
         caption="my caption")+
    geom_bar(aes(x=carname,
                 y=wt,
                 fill=as.factor(cyl)),
             stat="identity")+
    coord_flip()+
    facet_wrap(vars(cyl),
               scales="free_y")+
    theme(legend.position = "top",
          legend.justification = "left",
          plot.title.position = "plot",
          plot.caption = element_text(hjust=0),
          plot.caption.position = "plot")

Created on 2020-01-17 by the reprex package (v0.3.0.9000)

2 Likes

Occult knowledge! I seldom venture into development versions.

You can specify the position relative to the plot but then it loses its padding and I can't find how to get it back.

library(tidyverse)

mtcars %>% 
    rownames_to_column(., var="carname") %>% 
    ggplot()+
    labs(title="my tile",
         subtitle="my subtitle",
         caption="my caption")+
    geom_bar(aes(x=carname,
                 y=wt,
                 fill=as.factor(cyl)),
             stat="identity")+
    coord_flip(clip = "off")+
    facet_wrap(vars(cyl),
               scales="free_y")+
    theme(legend.position = c(0, 1),
          legend.direction = "horizontal",
          plot.title.position = "plot",
          plot.caption = element_text(hjust=0),
          plot.caption.position = "plot")

2 Likes

This topic was automatically closed 21 days after the last reply. New replies are no longer allowed.