Solved
The problem was with the class of the common identifier "ID_2" used for the left_join. I'm not sure why polygon values were so wildly misassigned when not a character, but changing the identifier to character class solved the problem. In other words, this just required adding:
shapefile@data$ID_2 <- as.character(shapefile@data$ID_2)
wikiraw$ID_2 <- as.character(wikiraw$ID_2)
to the end of the global section.
I'm trying to produce a Shiny app with Leaflet that renders a choropleth map based on different input criteria. The map displays incidents of different types (input$type) and backgrounds (input$background) and filters by date (input$incident_date). When additional types or backgrounds are specified, polygons are filled with updated incident data. It is rendering correctly in RStudio. However, when I deploy to shinyapps.io the values displayed in polygons shift and display incorrectly. The images below demonstrate the issue. In the first, polygons display correct values. In the second, as should be clear, the colouring and values reported as contained in polygons have changed and are incorrect. Can anyone provide any insights as to why this might happen as a result of deployment? I'm just working with a subsample of data at present so a lot of values are NA (in case anyone was wondering about all the grey space).
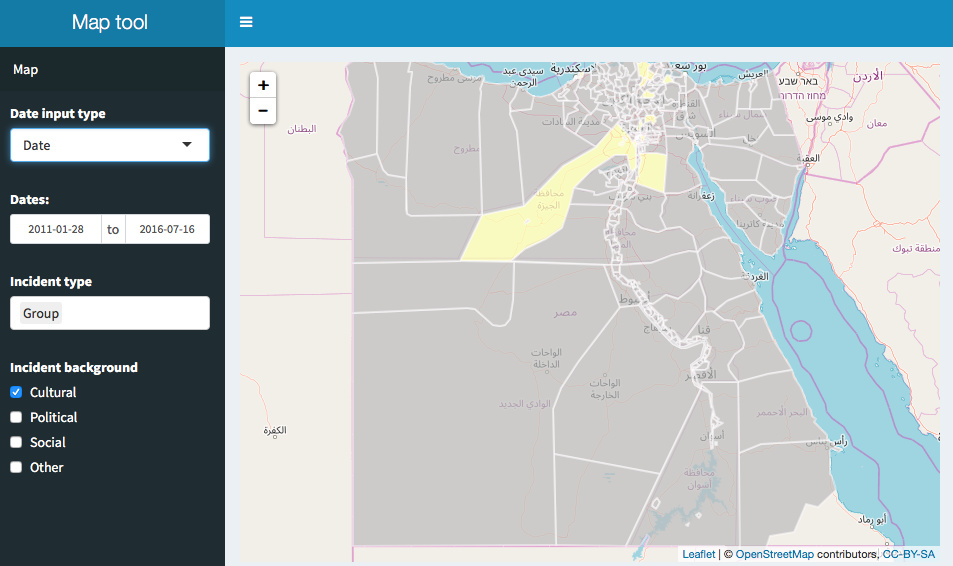
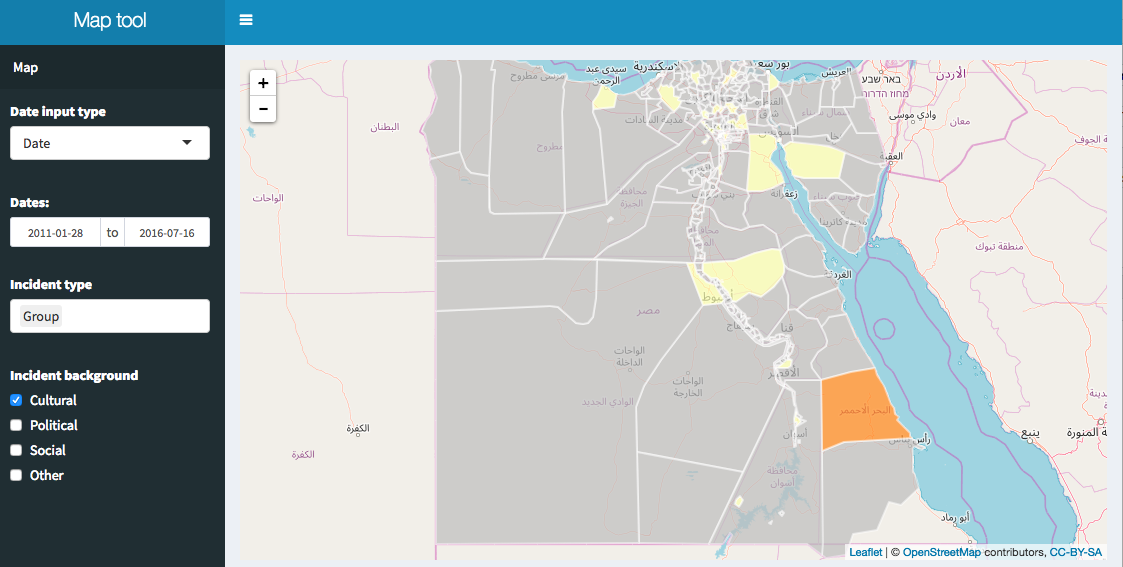
The values contained in the polygons (that you see e.g. when hovering over after enabling highlight options) are values that are contained in the dataset (i.e., are values that some polygons do actually contain) but are seemingly assigned to and displayed in the wrong districts.
The raw data and shapefile used can be accessed here: GitHub - cjbarrie/shiny_egy: Egypt Shiny maps.
Working example:
Name of raw data: wikiraw
Name of shapefile: shapefile
Global:
library(shiny)
library(shinydashboard)
library(shinythemes)
library(leaflet)
library(rgdal)
library(rmapshaper)
library(sp)
library(dplyr)
library(lubridate)

wikiraw <-read.csv("wikisample_SO.csv")
shapefile <- readOGR("EGY_adm2.shp")
shapefile<-spTransform(shapefile, CRS("+init=epsg:4326"))
## Simplify shapefile to speed up rendering
shapefile <- ms_simplify(shapefile, keep = 0.01, keep_shapes = TRUE)
wikbounds<-bbox(shapefile)
wikiraw$incident_date <- as.Date(wikiraw$incident_date,
                                 format = "%m/%d/%Y")
wikiraw$presidency <- rep(NA, nrow(wikiraw))
wikiraw$incident_date1 <- as.numeric(wikiraw$incident_date)
wikiraw$event <- rep(1,nrow(wikiraw))
## Generate presidency categorical var.
wikiraw$presidency <- cut(wikiraw$incident_date1,
                          breaks = c(-Inf, 15016, 15521, 15889, 16229, Inf),
                          labels = c("President1", "President2", "President3", "President4", "President5"),
                          right = FALSE)
Snippet of data.frame wikiraw:
  ID_2 incident_date incident_background incident_type presidency event
1  168    2013-11-26            Cultural         Group President4     1
2  133    2013-11-29            Cultural         Group President4     1
3  137    2014-01-25            Cultural         Group President4     1
4  168    2011-01-28            Cultural    Collective President1     1
5  168    2016-04-25            Cultural         Group President5     1
6  163    2015-02-08           Political    Individual President5     1
UI:
ui <- dashboardPage(
                    dashboardHeader(title = "Map tool"),
                    dashboardSidebar(sidebarMenu(menuItem("Map", tabName = "map"),
                                                 selectInput("input_type", "Date input type",
                                                             c("Date", "Presidency")),
                                                 uiOutput("dateSelect"),
                                                 uiOutput("typeSelect"),
                                                 uiOutput("backgroundSelect"),
                                                 uiOutput("presidentSelect"))),
                    dashboardBody(tabItems(
                      tabItem(tabName = "map",
                              leafletOutput("mymap", height=500)))))
Server:
server <- function(input, output, session) {

  output$dateSelect <- renderUI({
    switch(input$input_type,
           "Date" = dateRangeInput("dateInput", "Dates:",
                                   min=min(wikiraw$incident_date), max = max(wikiraw$incident_date),
                                   start = min(wikiraw$incident_date), end = max(wikiraw$incident_date)),
           "Presidency" = checkboxGroupInput("president", "Presidency",
                                             choices = levels(wikiraw$presidency),
                                             selected = "President1"))
  })

  output$typeSelect <- renderUI({
    selectInput("type", "Incident type",
                choices = unique(wikiraw$incident_type), multiple = TRUE,
                selected = wikiraw$incident_type[1])})

  output$backgroundSelect <- renderUI({
    checkboxGroupInput("background", "Incident background",
                       choices = unique(wikiraw$incident_background),
                       selected = wikiraw$incident_background[1])})


  selected <- reactive({
    wikiagg <- wikiraw %>% group_by(ID_2, incident_date, incident_type, incident_background, presidency) %>%
      summarize(sum_event = sum(event))
    if(input$input_type=="Date"){wikiagg <- filter(wikiagg,
                                                   incident_date >= min(input$dateInput),
                                                   incident_date <= max(input$dateInput),
                                                   incident_type%in%input$type,
                                                   incident_background%in%input$background)}
    if(input$input_type=="Presidency"){wikiagg <- filter(wikiagg,
                                                         incident_type%in%input$type,
                                                         incident_background%in%input$background,
                                                         presidency%in%input$president)}

    wikiagg <- wikiagg %>% group_by(ID_2) %>%
      summarize(sum_event = sum(sum_event))
    wikiagg
  })

  output$mymap <- renderLeaflet({

    leaflet() %>%
      addTiles() %>%
      setView(mean(wikbounds[1,]),
              mean(wikbounds[2,]),
              zoom=6
      )
  })

  observe({
    if(!is.null(input$dateInput)){
      shapefile@data <- left_join(shapefile@data, selected(), by="ID_2")

      ##Define palette across range of data
      wikiaggpal <- wikiraw %>% group_by(ID_2) %>%
        summarize(sum_event = sum(event))
      pal <- colorBin("YlOrRd", wikiaggpal$sum_event, bins=5, na.color = "#bdbdbd")


      leafletProxy("mymap", data = shapefile) %>%
        addTiles() %>%
        clearShapes() %>%
        addPolygons(data = shapefile, fillColor = ~pal(sum_event), fillOpacity = 0.7,
                    color = "white", weight = 2)
    }})
}
shinyApp(ui, server)
Thank you community for your help!