I am looking to create a possion distribution line against a current plot. Being new to this kind of statistics I am not sure how to begin with this.
I've seen this video on how to explore the possion model although I cannot figure out how to express this over .R programming.
Ex 1) The Poisson Distribution in R
Ex 2) https://www.youtube.com/watch?v=BbLfV0wOeyc
The current data-set that I am working with is a calculations of a value of each day. I have plotted this, on a ggplot and I would like to create a similar table for the possion table to compare the results on the same graph.
attached I have included a link to downloadable .csv for the dataset
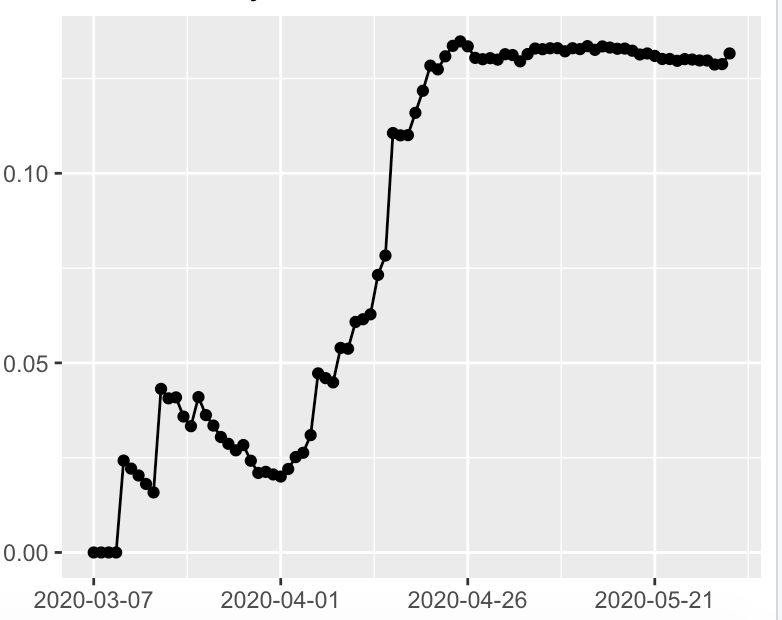
Attached is a picture of my current plot