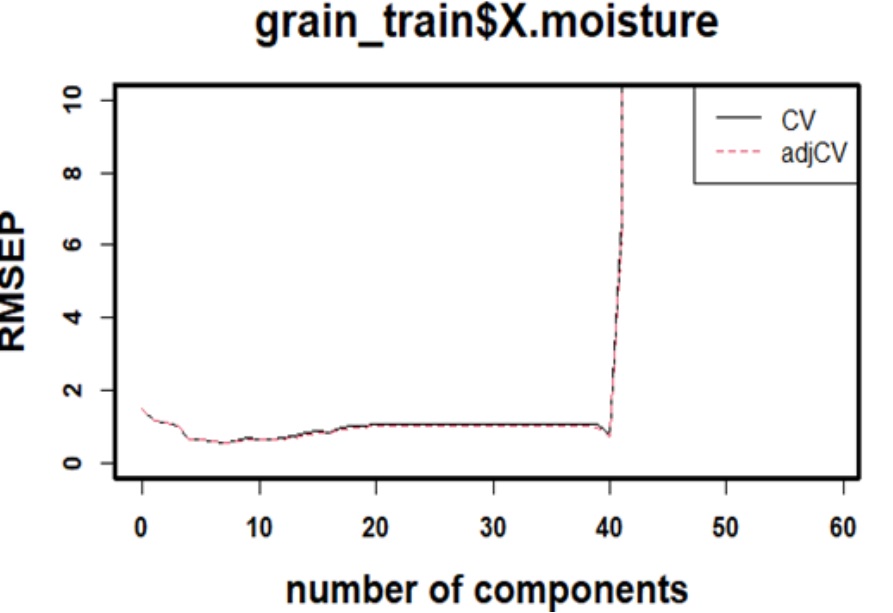
This case is with PLSR in R, using pls package: Wherein the RMSE plot denotes setting of error as no of components increase ( in normal cases), but here its getting shot up in the end. If this is selected, A very large number of components can make the model overfit.
component selection can be carried ahead still, by ignoring the abnormality.
but, will be any erroneous for the working of model on external data later on? [ it is seen already that,
the train & test outcomes(predicts) were aligning well with the given references(measured values) . and external outcomes (predicts) were outbound in nature & level , than measured. ]
Can you send us the code and data? This is very interesting and I'm having a hard time seeing how such a huge spike would happen. I'm guessing that there is some divide-by-(near)-zero happening.
yes, this might be rooted from divide-by-(near)-zero case. and this happens even with Python code. I wil let you know about data and code in a while.
yes Max,
here is the code.
require(tidyverse)
library(readxl)
setwd("....")
data <- read_excel("...")
##################### PLSR ##################################################################
library(pls)
set.seed(2023)
grain.plsr <-plsr(grain_train$Property_1~., data=grain_train , validation = "CV", method= "kernelpls")
summary(grain.plsr)
plot(RMSEP(grain.plsr),cex=1, legendpos = "topright", font.lab=2, cex.lab=1.5,cex.main=1.75, font=2, ylim = c(0, 10))
box(lwd=3)
And, find the attachment here takes only image files. Please let know how to send the data file , as csv or excel format?
This topic was automatically closed 21 days after the last reply. New replies are no longer allowed.
If you have a query related to it or one of the replies, start a new topic and refer back with a link.