I tried to use plot for the data of Global.ts but failed.
TG,
> Global.ts <- ts(Global, st = c(1856, 1), end = c(2005, 12),
+ fr = 12)
Warning message:
In data.matrix(data) : NAs introduced by coercion
> Global.annual <- aggregate(Global.ts, FUN = mean)
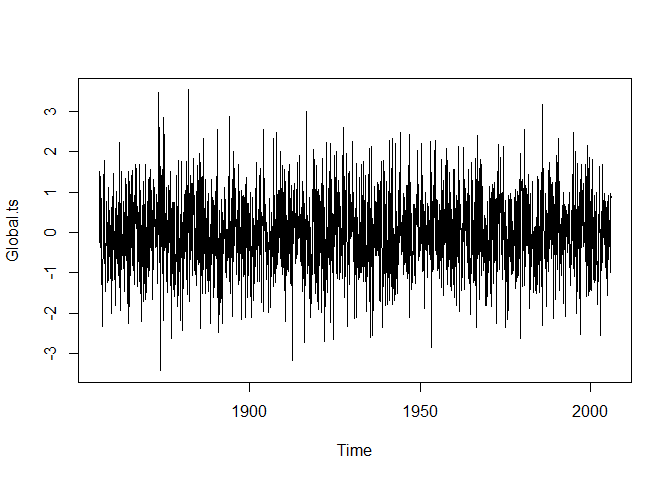
> plot(Global.ts)
Error in plot.window(xlim, ylim, log, ...) : need finite 'ylim' values
In addition: Warning messages:
1: In min(x) : no non-missing arguments to min; returning Inf
2: In max(x) : no non-missing arguments to max; returning -Inf
> plot(Global.annual)
Error in plot.window(xlim, ylim, log, ...) : need finite 'ylim' values
In addition: Warning messages:
1: In min(x) : no non-missing arguments to min; returning Inf
2: In max(x) : no non-missing arguments to max; returning -Inf
> New.series <- window(Global.ts, start=c(1970, 1), end=c(2005, 12))
> New.time <- time(New.series)
> plot(New.series); abline(reg=lm(New.series ~ New.time))
Error in plot.window(xlim, ylim, log, ...) : need finite 'ylim' values
In addition: Warning messages:
1: In min(x) : no non-missing arguments to min; returning Inf
2: In max(x) : no non-missing arguments to max; returning -Inf
FJCC
September 10, 2019, 12:44pm
2
There appears to be a problem with the object Global but it is hard to say what it is without more information. If I invent some data for Global, the code works fine.
str(Global)
Global <- rnorm(150*12)
Global.ts <- ts(Global, st = c(1856, 1), end = c(2005, 12), fr = 12)
plot(Global.ts)
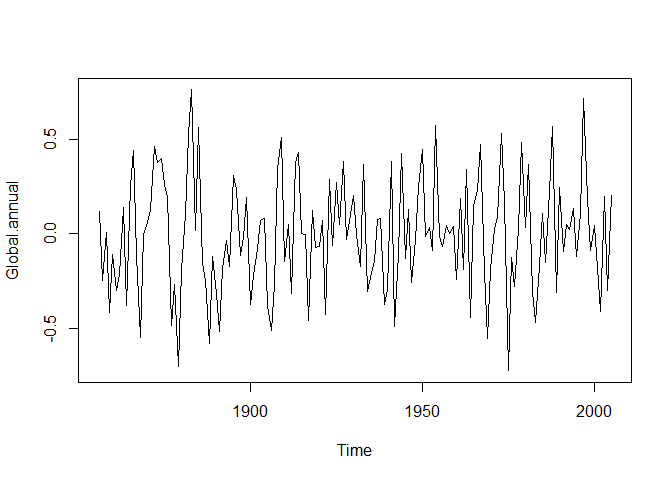
Global.annual <- aggregate(Global.ts, FUN = mean)
plot(Global.annual)
Created on 2019-09-10 by the reprex package (v0.2.1)
thank you very much for your nice suggestions.
# A tibble: 150 x 1
   X1
   <chr>
 1 -0.384 -0.457 -0.673 -0.344 -0.311 -0.071 -0.246 -0.235 -0.380 -0.418 -0.670 -~
 2 -0.437 -0.150 -0.528 -0.692 -0.629 -0.363 -0.375 -0.328 -0.495 -0.646 -0.754 -~
 3 -0.452 -1.031 -0.643 -0.328 -0.311 -0.263 -0.248 -0.274 -0.203 -0.121 -0.913 -~
 4 -0.249 -0.041 -0.082 -0.172 -0.085 -0.278 -0.220 -0.132 -0.436 -0.234 -0.288 -~
 5 -0.070 -0.526 -0.599 -0.420 -0.273 -0.063 -0.182 -0.256 -0.213 -0.326 -0.696 -~
 6 -0.858 -0.415 -0.431 -0.443 -0.735 -0.169 -0.227 -0.131 -0.377 -0.375 -0.434 -~
 7 -0.711 -0.817 -0.435 -0.232 -0.194 -0.322 -0.466 -0.623 -0.345 -0.382 -0.932 -~
 8 0.263 -0.063 -0.379 -0.187 -0.320 -0.365 -0.510 -0.359 -0.291 -0.431 -0.362 -0~
 9 -0.834 -0.604 -0.516 -0.482 -0.399 -0.200 -0.138 -0.332 -0.394 -0.711 -0.507 -~
10 -0.125 -0.615 -0.597 -0.135 -0.152 -0.227 -0.153 -0.267  0.002 -0.358 -0.200 -~
# ... with 140 more rows
> str(global)
Classes ‘spec_tbl_df’, ‘tbl_df’, ‘tbl’ and 'data.frame':	150 obs. of  1 variable:
 $ X1: chr  "-0.384 -0.457 -0.673 -0.344 -0.311 -0.071 -0.246 -0.235 -0.380 -0.418 -0.670 -0.386" "-0.437 -0.150 -0.528 -0.692 -0.629 -0.363 -0.375 -0.328 -0.495 -0.646 -0.754 -0.137" "-0.452 -1.031 -0.643 -0.328 -0.311 -0.263 -0.248 -0.274 -0.203 -0.121 -0.913 -0.197" "-0.249 -0.041 -0.082 -0.172 -0.085 -0.278 -0.220 -0.132 -0.436 -0.234 -0.288 -0.486" ...
 - attr(*, "spec")=
  .. cols(
  ..   X1 = col_character()
  .. )
> global.ts <- ts(global, st = c(1856, 1), end = c(2005, 12),
+                 fr = 12)
Warning message:
In data.matrix(data) : NAs introduced by coercion.
Could you find any problems?
TG
FJCC
September 11, 2019, 4:27am
4
truegrit:
str(global)
Notice in the output of str(global) that the data have been interpreted as the type character as can be seen in
$X1: chr
and the double quotes that surround each row of data. The first row is
"-0.384 -0.457 -0.673 -0.344 -0.311 -0.071 -0.246 -0.235 -0.380 -0.418 -0.670 -0.386"
It looks to me like the data values are separated by a space. How were the data read into the tibble?
global_df <- read.table("c:/users/fjcc/Documents/R/Play/Dummy.csv",
header = FALSE, sep = " ")
global_df
#> V1 V2 V3 V4 V5 V6 V7 V8 V9 V10
#> 1 -0.384 -0.457 -0.673 -0.344 -0.311 -0.071 -0.246 -0.235 -0.380 -0.418
#> 2 -0.437 -0.150 -0.528 -0.692 -0.629 -0.363 -0.375 -0.328 -0.495 -0.646
#> 3 -0.452 -1.031 -0.643 -0.328 -0.311 -0.263 -0.248 -0.274 -0.203 -0.121
#> 4 -0.249 -0.041 -0.082 -0.172 -0.085 -0.278 -0.220 -0.132 -0.436 -0.234
#> V11 V12
#> 1 -0.670 -0.386
#> 2 -0.754 -0.137
#> 3 -0.913 -0.197
#> 4 -0.288 -0.486
t_global = t(as.matrix(global_df))
global <- as.vector(t_global)
global[1:8]
#> [1] -0.384 -0.457 -0.673 -0.344 -0.311 -0.071 -0.246 -0.235
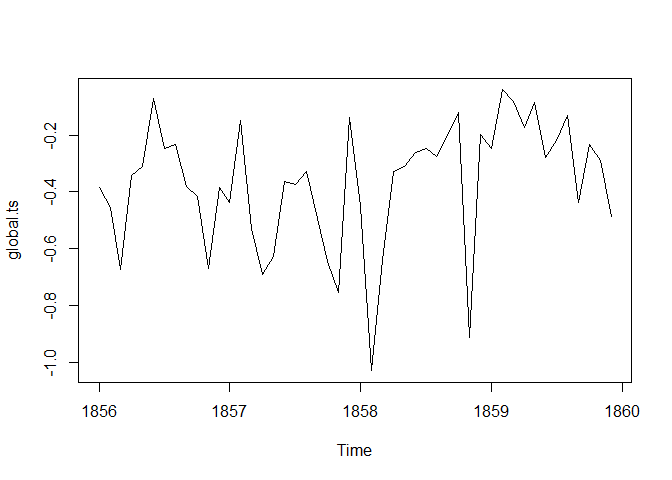
global.ts = ts(global, start = c(1856, 1), end = c(1859, 12), fr = 12)
plot(global.ts)
global.annual <- aggregate(global.ts, FUN = mean)
plot(global.annual)
Created on 2019-09-10 by the reprex package (v0.2.1)
FJCC
September 11, 2019, 5:09am
5
Here is another solution with tidy function.
library(tidyr)
library(dplyr)

global_df <- read.table("c:/users/fjcc/Documents/R/Play/Dummy.csv",
                     header = FALSE, sep = " ")
global_df
#>       V1     V2     V3     V4     V5     V6     V7     V8     V9    V10
#> 1 -0.384 -0.457 -0.673 -0.344 -0.311 -0.071 -0.246 -0.235 -0.380 -0.418
#> 2 -0.437 -0.150 -0.528 -0.692 -0.629 -0.363 -0.375 -0.328 -0.495 -0.646
#> 3 -0.452 -1.031 -0.643 -0.328 -0.311 -0.263 -0.248 -0.274 -0.203 -0.121
#> 4 -0.249 -0.041 -0.082 -0.172 -0.085 -0.278 -0.220 -0.132 -0.436 -0.234
#>      V11    V12
#> 1 -0.670 -0.386
#> 2 -0.754 -0.137
#> 3 -0.913 -0.197
#> 4 -0.288 -0.486
colnames(global_df) <- c("M01", "M02", "M03", "M04", "M05", "M06",
               "M07", "M08", "M09", "M10", "M11", "M12")
global_df <- global_df %>% mutate(Year = seq(1856, 1859))
global_df
#>      M01    M02    M03    M04    M05    M06    M07    M08    M09    M10
#> 1 -0.384 -0.457 -0.673 -0.344 -0.311 -0.071 -0.246 -0.235 -0.380 -0.418
#> 2 -0.437 -0.150 -0.528 -0.692 -0.629 -0.363 -0.375 -0.328 -0.495 -0.646
#> 3 -0.452 -1.031 -0.643 -0.328 -0.311 -0.263 -0.248 -0.274 -0.203 -0.121
#> 4 -0.249 -0.041 -0.082 -0.172 -0.085 -0.278 -0.220 -0.132 -0.436 -0.234
#>      M11    M12 Year
#> 1 -0.670 -0.386 1856
#> 2 -0.754 -0.137 1857
#> 3 -0.913 -0.197 1858
#> 4 -0.288 -0.486 1859
global_df <- global_df %>% gather(key = Month, value = Value, M01:M12) %>%
  arrange(Year, Month)
head(global_df)
#>   Year Month  Value
#> 1 1856   M01 -0.384
#> 2 1856   M02 -0.457
#> 3 1856   M03 -0.673
#> 4 1856   M04 -0.344
#> 5 1856   M05 -0.311
#> 6 1856   M06 -0.071

global.ts = ts(global_df$Value, start = c(1856, 1), end = c(1859, 12), fr = 12)
plot(global.ts)
global.annual <- aggregate(global.ts, FUN = mean)
plot(global.annual)
Created on 2019-09-10 by the reprex package (v0.2.1)
Thank you very much for your great guidance!%>%.
 global_df <- read_table("C:/Users/hwang/Desktop/Econometric Analysis/Rintrodata/global.dat",
+     col_names = FALSE, "")
> view(global_df)
Error in view(global_df) : could not find function "view"
> global_df
# A tibble: 150 x 12
       X1     X2     X3     X4     X5     X6     X7     X8     X9    X10    X11    X12
    <dbl>  <dbl>  <dbl>  <dbl>  <dbl>  <dbl>  <dbl>  <dbl>  <dbl>  <dbl>  <dbl>  <dbl>
 1 -0.384 -0.457 -0.673 -0.344 -0.311 -0.071 -0.246 -0.235 -0.38  -0.418 -0.67  -0.386
 2 -0.437 -0.15  -0.528 -0.692 -0.629 -0.363 -0.375 -0.328 -0.495 -0.646 -0.754 -0.137
 3 -0.452 -1.03  -0.643 -0.328 -0.311 -0.263 -0.248 -0.274 -0.203 -0.121 -0.913 -0.197
 4 -0.249 -0.041 -0.082 -0.172 -0.085 -0.278 -0.22  -0.132 -0.436 -0.234 -0.288 -0.486
 5 -0.07  -0.526 -0.599 -0.42  -0.273 -0.063 -0.182 -0.256 -0.213 -0.326 -0.696 -0.813
 6 -0.858 -0.415 -0.431 -0.443 -0.735 -0.169 -0.227 -0.131 -0.377 -0.375 -0.434 -0.209
 7 -0.711 -0.817 -0.435 -0.232 -0.194 -0.322 -0.466 -0.623 -0.345 -0.382 -0.932 -0.768
 8  0.263 -0.063 -0.379 -0.187 -0.32  -0.365 -0.51  -0.359 -0.291 -0.431 -0.362 -0.276
 9 -0.834 -0.604 -0.516 -0.482 -0.399 -0.2   -0.138 -0.332 -0.394 -0.711 -0.507 -0.587
10 -0.125 -0.615 -0.597 -0.135 -0.152 -0.227 -0.153 -0.267  0.002 -0.358 -0.2   -0.324
# ... with 140 more rows
> colnames(global_df) <- c("M01", "M02", "M03", "M04", "M05", "M06",
+                          "M07", "M08", "M09", "M10", "M11", "M12")
>
> global_df <- global_df %>% mutate(Year = seq(1856, 1859))
Error in global_df %>% mutate(Year = seq(1856, 1859)) :
  could not find function "%>%"
Could you help me this problem?
TG
FJCC
September 11, 2019, 11:36am
7
Did you include the loading of libraries in your script?
library(tidyr)
library(dplyr)
If so, add
library(magrittr)
to those calls, though it should not be necessary.
1 Like
Thank you very much for your great help!
TG
Thank you very much for your detailed explanation!
TG
I did not have these packages and downloaded!
Insang
system
September 24, 2019, 12:40pm
11
This topic was automatically closed 7 days after the last reply. New replies are no longer allowed.