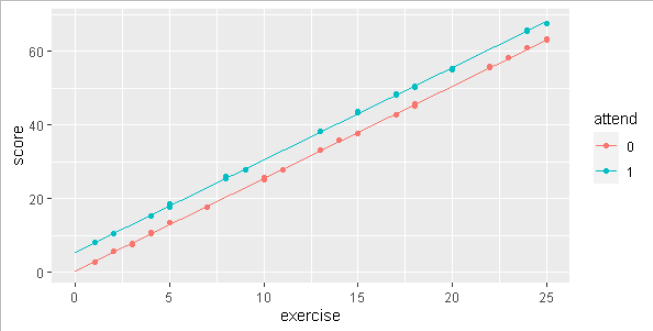
I woul need help with plotting regression slopes for dummy variable. I would like to get the same plot as the one from the image .
Dataset has three variables: score (score achieved at exam), exercise (number of hours spent preparing for exam) and attend (dummy variable with two levels - 0 - didn't attend lectures and 1 - attended lectures)
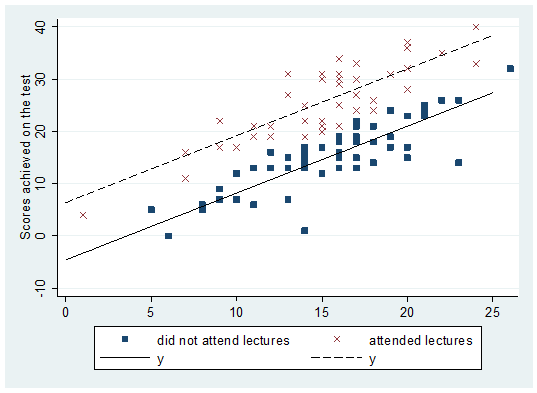
I would like to plote regression slopes for those who have attended lectures and those who didn't. Plot from image is created in Stata but I would like to recreate it in R.
In Stata it's created by function
scatter score exercise if attend == 0, msymbol(square) legend(lab(1 "did not attend lectures")) ///
|| scatter score exercise if attend == 1, msymbol(lgx) legend(lab(2 "attended lectures")) ///
|| function y = -4.58 + 1.28x, range(0 25) lcolor(black) ///
|| function y = 6.41 + 1.28x, range(0 25) lcolor(black) lpattern(dash) ///
ytitle("Scores achieved on the test")
Thank you but I use R Studio for a long time and I don't have problem with plotting but in this case I would need to come up with function that would plot regression slop fro dummy coded variables.
Dear nirgrahamum I would like to thank you for your kind feedback but I need to recreate plot from the image that I've uploded. If you can help me with that great if not thank you.
 .
.