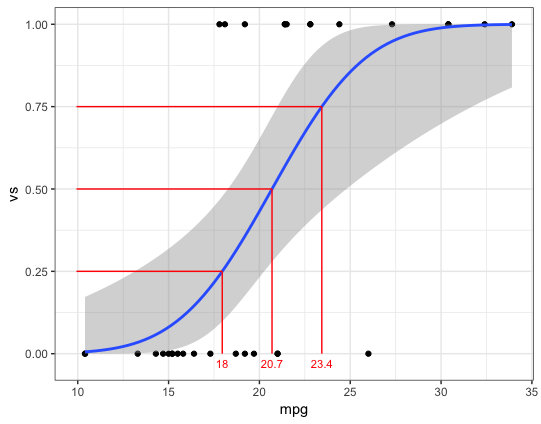
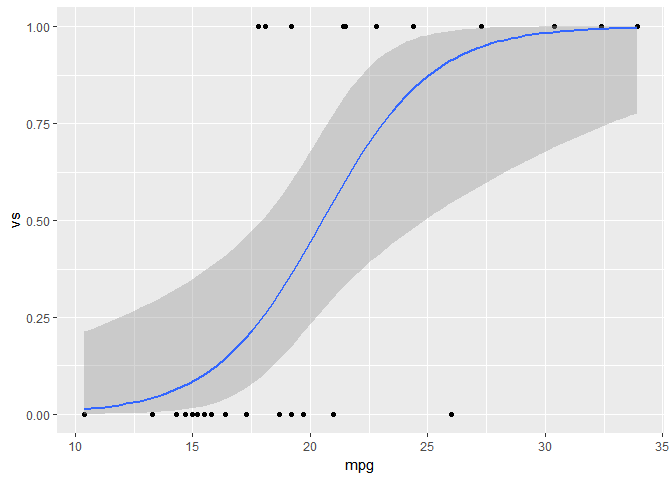
As discussed in the answer linked by Mara, you can set the link function to "probit" to get a probit regression using stat_smooth. Below I've also added a helper function to get the mpg values at various vs probabilities:
# Function to get mpg value for a given vs probability
probX = function(p, model) {
  data.frame(prob=p,
             xval = (qnorm(p) - coef(model)[1])/coef(model)[2])
}

d = probX(c(0.25,0.5,0.75), logr_vm)

ggplot(mtcars, aes(x=mpg, y=vs)) +
  geom_point() +
  stat_smooth(method="glm", method.args=list(family=binomial(link="probit"))) +
  geom_segment(data=d, aes(x=xval, xend=xval, y=0, yend=prob), colour="red") +
  geom_segment(data=d, aes(x=rng[1], xend=xval, y=prob, yend=prob), colour="red") +
  geom_text(data=d, aes(label=round(xval, 1), x=xval, y=-0.03), size=3, colour="red") +
  theme_bw()

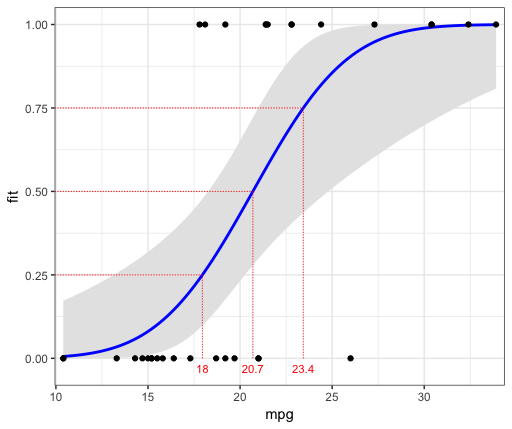
You can also calculate the fitted values and confidence intervals outside of ggplot, which will give you more flexibility if you create models with multiple covariates. For example:
# Regression model
logr_vm <- glm(vs ~ mpg, data=mtcars, family=binomial(link="probit"))

# Get predictions on link scale
pred = data.frame(mpg=seq(min(mtcars$mpg), max(mtcars$mpg), length=100))
pred = cbind(pred,
                        predict(logr_vm, newdata=pred, type="link", se.fit=TRUE)[c("fit", "se.fit")])

# Calculate fit and confidence interval on probability scale
pred$upr = logr_vm$family$linkinv(pred$fit + 1.96*pred$se.fit)  # Equivalent to pnorm(pred$fit + 1.96*pred$se.fit) for the probit link
pred$lwr = logr_vm$family$linkinv(pred$fit - 1.96*pred$se.fit)
pred$fit = logr_vm$family$linkinv(pred$fit)

# Function to get mpg value for a given vs probability
probX = function(p, model) {
  data.frame(prob=p,
             xval = (qnorm(p) - coef(model)[1])/coef(model)[2])
}

# Set plot x-range
rng = range(mtcars$mpg) + diff(range(mtcars$mpg))*c(-0.02,0.02)

ggplot(probX(c(0.25,0.5,0.75), logr_vm)) +
  geom_ribbon(data=pred, aes(mpg, ymin=lwr, ymax=upr), fill="grey90") +
  geom_line(data=pred, aes(mpg, fit), size=1, colour="blue") +
  geom_point(data=mtcars, aes(mpg, vs)) +
  geom_segment(aes(x=xval, xend=xval, y=0, yend=prob), colour="red", linetype="11", size=0.3) +
  geom_segment(aes(x=rng[1], xend=xval, y=prob, yend=prob), colour="red", linetype="11", size=0.3) +
  geom_text(aes(label=round(xval, 1), x=xval, y=-0.03), size=3, colour="red") +
  scale_x_continuous(limits=rng, expand=c(0,0)) +
  theme_bw()


