If you're OK with base R solution, here you go:
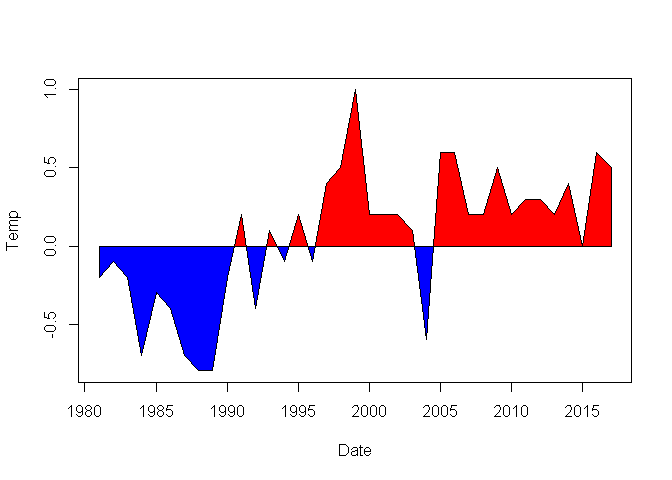
df <- data.frame(Date = c(1981, 1982, 1983, 1984, 1985, 1986, 1987, 1988, 1989, 1990, 1991, 1992, 1993,
                          1994, 1995, 1996, 1997, 1998, 1999, 2000, 2001, 2002, 2003, 2004, 2005, 2006,
                          2007, 2008, 2009, 2010, 2011, 2012, 2013, 2014, 2015, 2016, 2017),
                 Temp = c(-0.2, -0.1, -0.2, -0.7, -0.3, -0.4, -0.7, -0.8, -0.8, -0.2, 0.2, -0.4, 0.1,
                          -0.1, 0.2, -0.1, 0.4, 0.5, 1.0, 0.2, 0.2, 0.2, 0.1, -0.6, 0.6, 0.6,
                          0.2, 0.2, 0.5, 0.2, 0.3, 0.3, 0.2, 0.4, 0.0, 0.6, 0.5))

with(data = df,
     expr = {
       plot(x = Date,
            y = Temp,
            pch = NA_integer_)
       polygon(x = c(min(Date), Date, max(Date)),
               y = c(0, Temp, 0),
               col = "red")
       clip(x1 = min(Date),
            x2 = max(Date),
            y1 = min(Temp),
            y2 = 0)
       polygon(x = c(min(Date), Date, max(Date)),
               y = c(0, Temp, 0),
               col = "blue")
     })
Created on 2019-05-01 by the reprex package (v0.2.1)
Hope this helps.