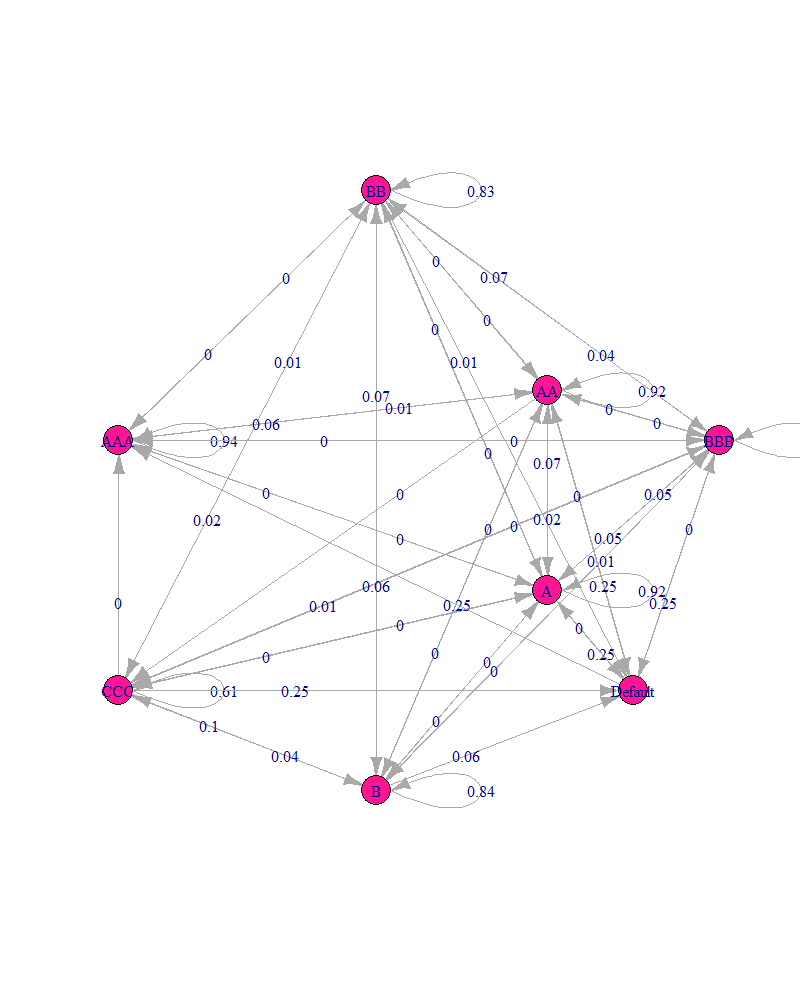
I am working with the R programming language.
I thought of the following "game":
- There are two coins : Coin 1 and Coin 2
- The player picks a random coin (i.e. 0.5 probability of picking either Coin 1 or Coin 2)
- Coin 1 has a 0.5 probability of landing on Heads and a 0.5 probability of landing on Tails
- Coin 2 has a 0.3 probability of landing on Heads and a 0.7 probability of landing on Tails
- If Coin 1 is Heads, the player gets a score of 1 else 0
- If coin 2 is Heads, the player gets a score of 2 else -1
- The player repeats this 3 times and records his final score
- Note: The player starts the game with score = 0
I want to make a "Markov Chain" (e.g. Getting Started with Markov Chains | R-bloggers , Markov chain - Wikipedia, Markov Chains and decimal points in r?) for this game that shows the probability of what score the player can have conditional on the current turn and current score - based on "simulated data" from this game. I wrote a simulation that plays this game 100 times:
library(dplyr)

results <- list()

 for (i in 1:100) {

iteration = i

coin_turn_1_i = sample(sample(c(1,2)), size =1, replace = T, prob= c(0.5,0.5))

score_turn_1_i = ifelse(coin_turn_1_i == 1, sample(sample(c(1,0)), size =1, replace = T, prob= c(0.5,0.5)), sample(sample(c(2,-1)), size =1, replace = T, prob= c(0.3,0.7)) )

coin_turn_2_i = sample(sample(c(1,2)), size =1, replace = T, prob= c(0.5,0.5))

score_turn_2_i = ifelse(coin_turn_2_i == 1, sample(sample(c(1,0)), size =1, replace = T, prob= c(0.5,0.5)), sample(sample(c(2,-1)), size =1, replace = T, prob= c(0.3,0.7)) )

cum_score_2_i = score_turn_2_i + score_turn_1_i

coin_turn_3_i = sample(sample(c(1,2)), size =1, replace = T, prob= c(0.5,0.5))

score_turn_3_i = ifelse(coin_turn_3_i == 1, sample(sample(c(1,0)), size =1, replace = T, prob= c(0.5,0.5)), sample(sample(c(2,-1)), size =1, replace = T, prob= c(0.3,0.7)) )

total_score_i = score_turn_3_i + cum_score_2_i


my_data_i = data.frame(iteration, coin_turn_1_i, score_turn_1_i, coin_turn_2_i, score_turn_2_i, cum_score_2_i, coin_turn_3_i, score_turn_3_i, total_score_i )

results[[i]] <- my_data_i

}

results_df <- data.frame(do.call(rbind.data.frame, results))
I tried to (manually) extract the "transition probabilities" between "turn 1 and turn 2" and "turn 2 and turn 3":
#turn 1 and turn 2

turn_1_and_turn_2 =  data.frame(results_df %>% group_by(score_turn_1_i, cum_score_2_i) %>% summarise(count = n()))

results_df %>% group_by(score_turn_1_i) %>% summarise(count = n())
# A tibble: 4 x 2
  score_turn_1_i count
           <dbl> <int>
1             -1    25
2              0    22
3              1    28
4              2    25

# transition probabilities
turn_1_and_turn_2$prob = ifelse(turn_1_and_turn_2$score_turn_1_i == -1, turn_1_and_turn_2$count/25, ifelse(turn_1_and_turn_2$score_turn_1_i == 0, turn_1_and_turn_2$count/22, ifelse(turn_1_and_turn_2$score_turn_1_i == 1, turn_1_and_turn_2$count/28, turn_1_and_turn_2$count/25)))

# turn 2 and turn 3


turn_2_and_turn_3 =  data.frame(results_df %>% group_by( cum_score_2_i, total_score_i) %>% summarise(count = n()))

results_df %>% group_by(cum_score_2_i) %>% summarise(count = n())

# A tibble: 7 x 2
  cum_score_2_i count
          <dbl> <int>
1            -2     5
2            -1    13
3             0    22
4             1    20
5             2    21
6             3    13
7             4     6

turn_2_and_turn_3$prob = ifelse(turn_2_and_turn_3$cum_score_2_i == -2, turn_2_and_turn_3$count/5, ifelse(turn_2_and_turn_3$cum_score_2_i == -1, turn_2_and_turn_3$count/13, ifelse(turn_2_and_turn_3$cum_score_2_i == 0, turn_2_and_turn_3$count/22, ifelse(turn_2_and_turn_3$cum_score_2_i == 1, turn_2_and_turn_3$count/20, ifelse(turn_2_and_turn_3$cum_score_2_i == 2, turn_2_and_turn_3$count/21, ifelse(turn_2_and_turn_3$cum_score_2_i == 3, turn_2_and_turn_3$count/13, turn_2_and_turn_3$count/6))))))
My Question: But from here, I do not know how to take "turn_1_and_turn_2$prob" and "turn_2_and_turn_3$prob" and convert them into a transition matrix - and then convert them into a "Markov Chain" :
Of course - I could manually enter the all the above probabilities into a matrix object:
#for a n-state transition matrix
transition_matrix = matrix(1:n^2, nrow = n, ncol = n)
But can someone please show me how to make this kind of Markov Chain directly from "results_df"? Is there a general method that can be used for "results_df" if the player flips the coin as much as he wants (e.g. 4 times)?
Thanks!
Note: In this game I have created, it seems that the game can end in 9 possible states - so I think this means that the transition matrix would be 9x9?
turn_2_and_turn_3 %>% group_by(total_score_i) %>% summarise(count = n())
# A tibble: 9 x 2
  total_score_i count
          <dbl> <int>
1            -3     1
2            -2     2
3            -1     3
4             0     3
5             1     4
6             2     4
7             3     4
8             4     3
9             5     2
